. 2013 Oct 18;288(42):30373-30386.
doi: 10.1074/jbc.M113.494583. Epub 2013 Sep 5.

Cysteine substitutions define etomidate binding and gating linkages in the α-M1 domain of γ-aminobutyric acid type A (GABAA) receptors

Affiliations

Cysteine substitutions define etomidate binding and gating linkages in the α-M1 domain of γ-aminobutyric acid type A (GABAA) receptors

Deirdre S Stewart et al. J Biol Chem. .

Abstract

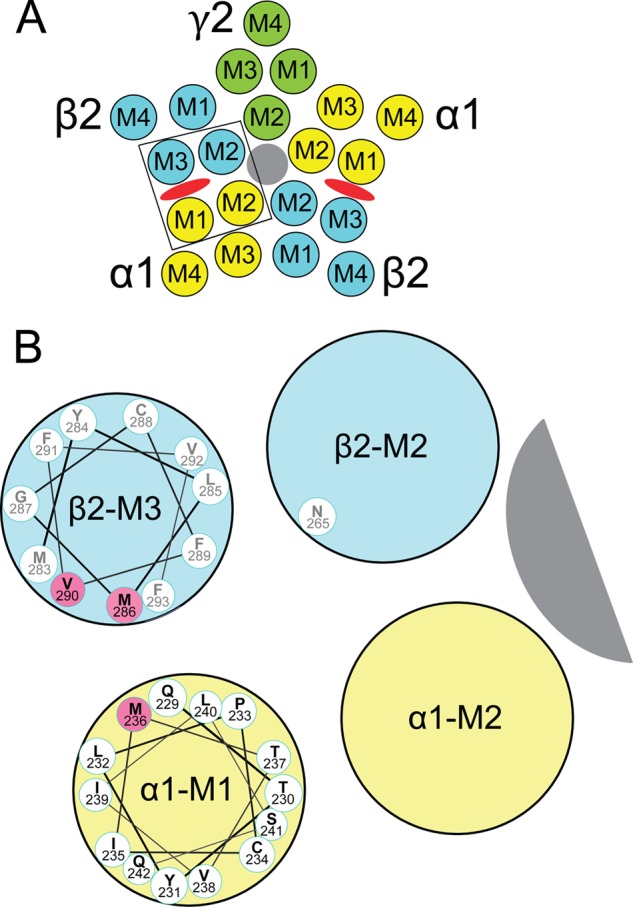
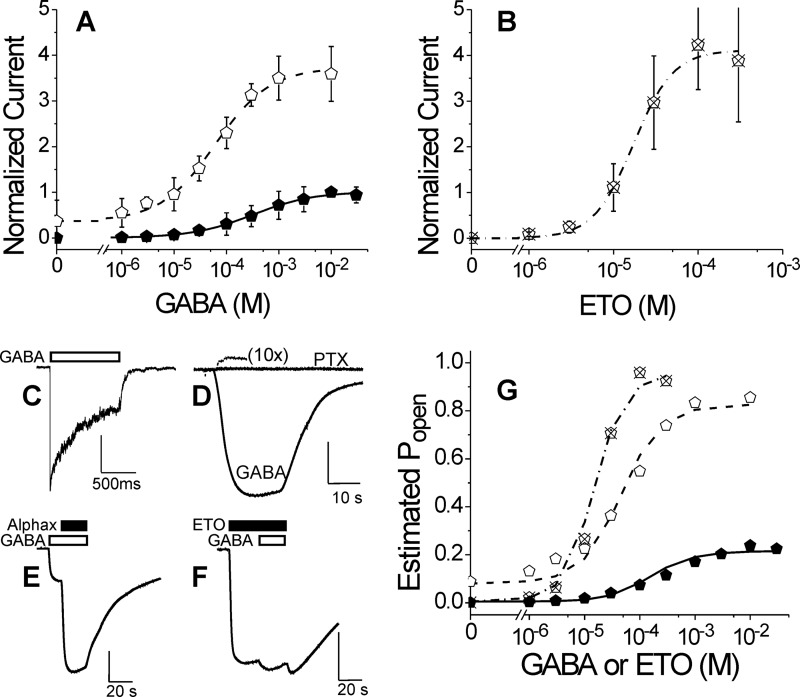
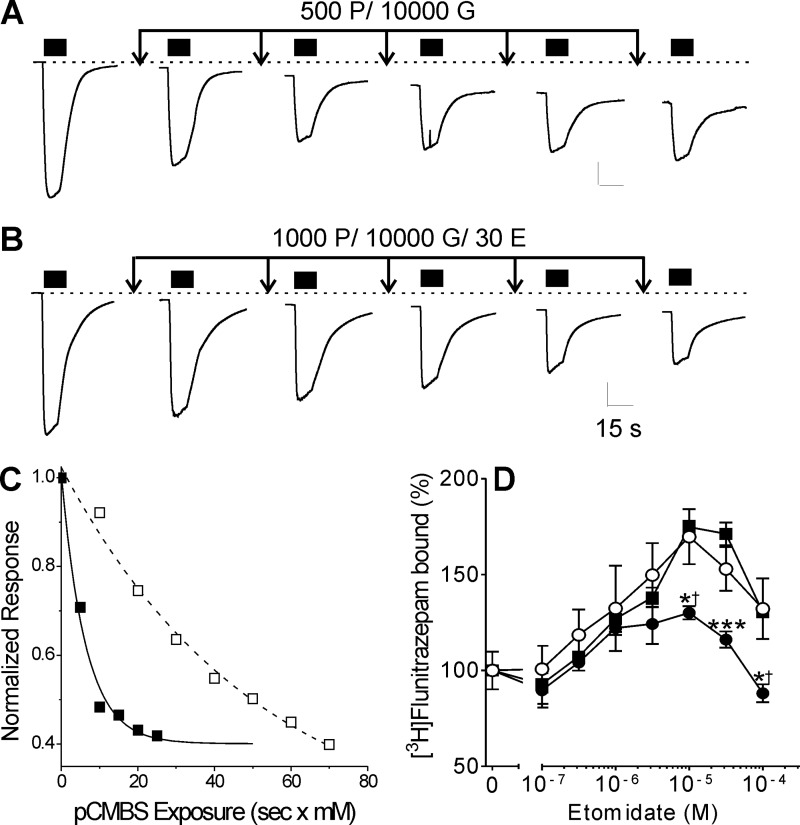
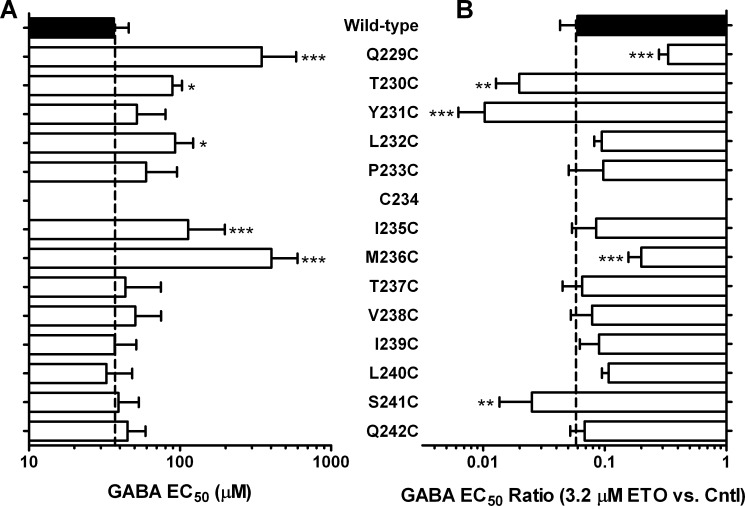
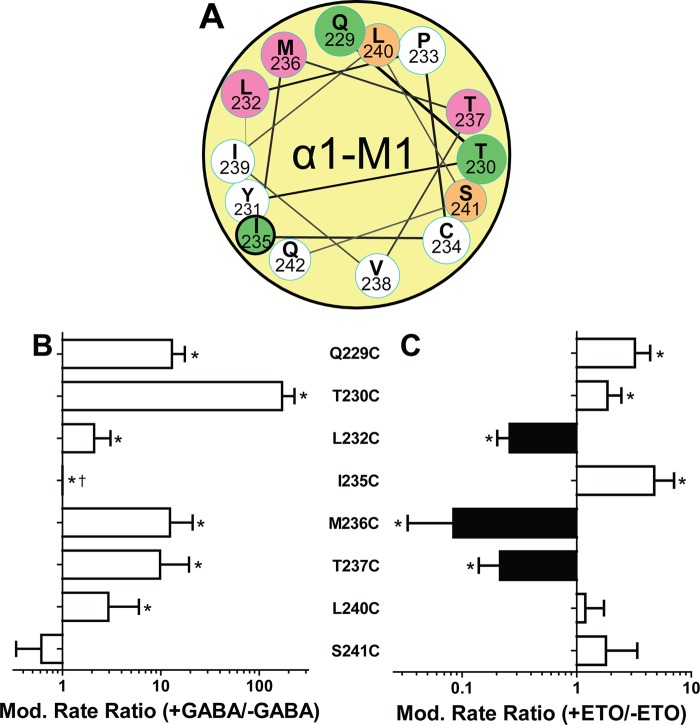
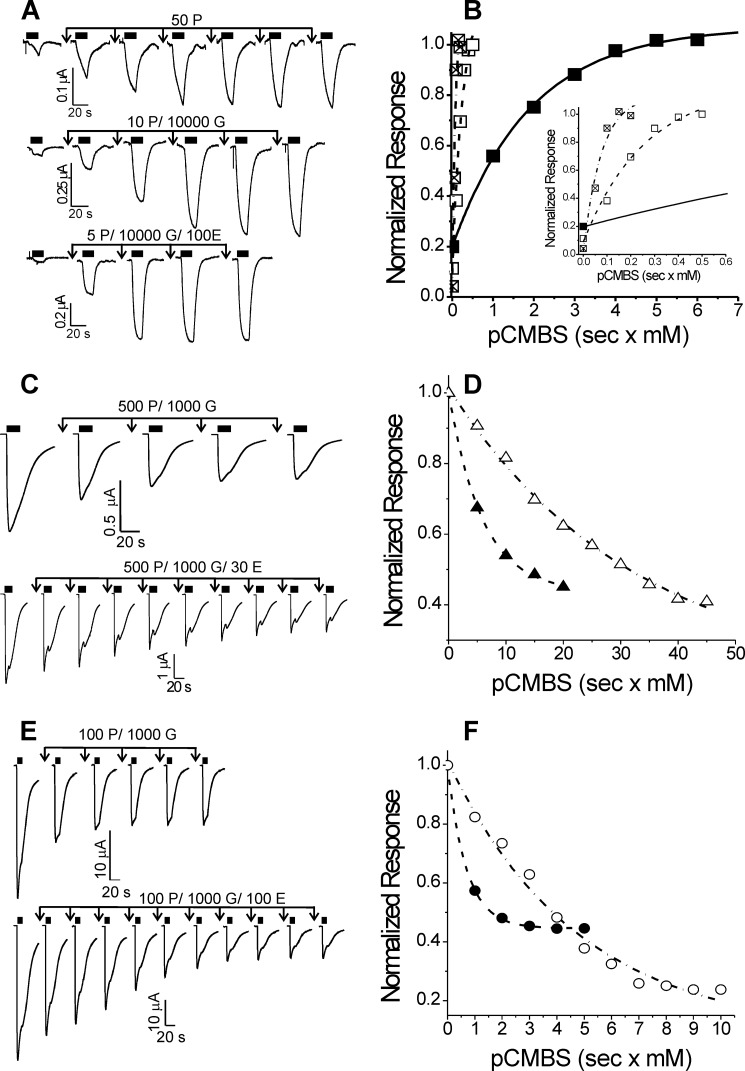
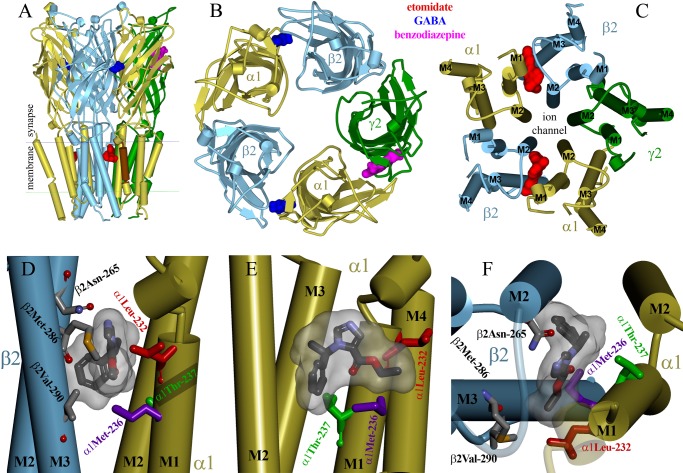
Etomidate is a potent general anesthetic that acts as an allosteric co-agonist at GABAA receptors. Photoreactive etomidate derivatives labeled αMet-236 in transmembrane domain M1, which structural models locate in the β+/α- subunit interface. Other nearby residues may also contribute to etomidate binding and/or transduction through rearrangement of the site. In human α1β2γ2L GABAA receptors, we applied the substituted cysteine accessibility method to α1-M1 domain residues extending from α1Gln-229 to α1Gln-242. We used electrophysiology to characterize each mutant's sensitivity to GABA and etomidate. We also measured rates of sulfhydryl modification by p-chloromercuribenzenesulfonate (pCMBS) with and without GABA and tested if etomidate blocks modification of pCMBS-accessible cysteines. Cys substitutions in the outer α1-M1 domain impaired GABA activation and variably affected etomidate sensitivity. In seven of eight residues where pCMBS modification was evident, rates of modification were accelerated by GABA co-application, indicating that channel activation increases water and/or pCMBS access. Etomidate reduced the rate of modification for cysteine substitutions at α1Met-236, α1Leu-232 and α1Thr-237. We infer that these residues, predicted to face β2-M3 or M2 domains, contribute to etomidate binding. Thus, etomidate interacts with a short segment of the outer α1-M1 helix within a subdomain that undergoes significant structural rearrangement during channel gating. Our results are consistent with in silico docking calculations in a homology model that orient the long axis of etomidate approximately orthogonal to the transmembrane axis.

Keywords: Allosteric Regulation; Anesthetics; GABA Receptors; Ion Channels; Nicotinic Acetylcholine Receptors; Sulfhydryl.


Figures

FIGURE 1.
FIGURE 1.
Transmembrane domains and amino acids forming etomidate sites in GABAA receptors. A, a diagram of a α1β2γ2L GABAA receptor cross-sectioned in the membrane plane and viewed from the extracellular space illustrates the arrangement of α1 (yellow), β2 (blue), and γ2 (green) subunits and the transmembrane domains (M1–M4) within each subunit. The chloride channel is shaded gray. Etomidate sites (red ovals) are located between α-M1 and β-M3 domains. B, an expanded diagram of one etomidate site (outlined in A), showing a helical wheel projection of the α1-M1 sequence from Gln-229 (nearest) through Gln-242. The orientation of the side chains is approximate and based on a homology model built from the structure of G. violaceous pentameric ion channels (33). GABAA receptor residues that are photolabeled by etomidate derivatives (13, 14), in both α-M1 and β-M3, are highlighted in pink. We also illustrate β2Asn-265 on β-M2, a residue where mutations influence etomidate sensitivity (37, 38).
FIGURE 2.
FIGURE 2.
Electrophysiological characterization of α1M236Cβ2γ2L GABAA receptors. A, GABA concentration response in oocytes. Data points are mean ± S.D. (error bars) (n > 3) peak currents normalized to maximal GABA (10 mm) responses. Lines overlaying points represent nonlinear least squares fits to Hill equations (Equation 1). Solid symbols, GABA alone; EC50 = 320 μm (95% confidence interval, 290–410 μm); nH = 0.75 ± 0.075. Open symbols, GABA plus 3.2 μm etomidate; EC50 = 61 μm (95% confidence interval, 56–77 μm); nH = 0.83 ± 0.071; maximum response = 3.7 ± 0.10. B, etomidate agonism concentration response in oocytes. Data points are mean ± S.D. (n > 3) peak currents normalized to maximal GABA (10 mm) responses. The line represents a fitted Hill equation. EC50 = 18 μm (95% confidence interval, 14–29 μm); nH = 1.7 ± 0.52; maximum response = 4.2 ± 0.63. C, current sweep recorded from an HEK293 cell patch during a 1-s pulse of 10 mm GABA. The white bar indicates GABA application. Average rates of activation, desensitization, and deactivation are summarized in Table 2. D, spontaneous channel gating current in an oocyte. The small outward current during PTX application is due to inhibition of active channels. Current elicited with 10 mm GABA in the same cell is also displayed. Average spontaneous activity is 1.8 ± 0.28% of maximal GABA response. E, estimation of maximal GABA efficacy in an oocyte. GABA (10 mm; white bar) alone elicits a current that is enhanced severalfold with co-application of alphaxalone (2 μm; black bar). Average results for GABA efficacy are reported in Table 1. F, estimation of etomidate agonist efficacy in an oocyte. Etomidate (100 μm; black bar) elicits a maximal current that is only modestly enhanced with co-application of GABA (3 mm; white bar). Average results for etomidate efficacy are reported in Table 1. G, allosteric co-agonist modeling of GABA and etomidate activation. Estimated Po was calculated using Equation 2 from data in A and B (same symbols used for each data set). Equation 3 was fitted to estimated Po using nonlinear least squares with both [GABA] and [etomidate] as input variables. Lines represent the fitted model. Fitted model parameters are reported in Table 3.
FIGURE 3.
FIGURE 3.
Cysteine modification and etomidate protection in heterologously expressed α1M236Cβ2γ2L GABAA receptors. A, traces represent sequential measurements of maximal current elicited with 10 mm GABA (black bars) in an oocyte expressing α1M236Cβ2γ2L GABAA receptors. Arrows, 10-s exposure to 10 mm GABA plus 500 μm pCMBS, followed by wash. Basal leak current increases and maximal GABA current diminishes with incremental exposure to pCMBS. B, traces are sequential maximal current tests (10 mm GABA; black bars) from another oocyte expressing α1M236Cβ2γ2L GABAA receptors. Arrows, 10-s exposure to 10 mm GABA plus 1 mm pCMBS plus 30 μm etomidate, followed by wash. C, rate analyses of peak current data from A and B are shown, plotted against cumulative [pCMBS] × exposure time. Lines represent nonlinear least squares fits to single exponential functions. The fitted time constants are 6.3 s × mm (control; solid symbols) and 51 s × mm (+ etomidate; open symbols). The second order rate constants are 157 and 20 m−1 s−1, respectively. D, data points represent mean ± S.E. (error bars) (n = 6) measurements of membrane-bound [3H]flunitrazepam, normalized to control (100%). Data were analyzed by ANOVA with Bonferroni post-tests. Etomidate at concentrations up to 30 μm positively modulates flunitrazepam binding to untreated membranes from HEK293 cells expressing α1M236Cβ2γ2L receptors (solid squares). Membranes pre-exposed to 2.5 mm MTSEA (solid circles) show significantly reduced etomidate modulation (*, p < 0.05; ***, p < 0.001). In membranes exposed to MTSEA in the presence of 200 μm etomidate (open circles), subsequent maximal etomidate modulation (at 10 μm) is indistinguishable from that in untreated membranes but significantly different from MTSEA-treated membranes (†, p < 0.05).
FIGURE 4.
FIGURE 4.
GABA sensitivity and etomidate modulation in α1-M1 cysteine substituted GABAA receptors. A, bars represent mean ± S.D. (error bars) GABA EC50 plotted on a log scale, averaged from multiple individual measurements in separate oocytes (n ≥ 4). B, bars represent mean ± S.D. GABA EC50 shift ratio in the presence versus absence of 3.2 μm etomidate, averaged from multiple individual measurements in separate oocytes (n ≥ 4) and plotted on a log scale. Large leftward shifts (low shift ratio) indicate high etomidate sensitivity. Mutant results were compared with wild type by ANOVA with Dunnett's post hoc test. *, p < 0.05; **, p < 0.01; ***, p < 0.001.
FIGURE 5.
FIGURE 5.
Effects of GABA and etomidate on modification rates of pCMBS-accessible α1-M1 cysteine substituted GABAA receptors. A, a helical wheel projection of α1-M1 similar to that in Fig. 1B shows pCMBS-modified residues as colored circles; green, modification enhanced by etomidate; magenta, modification reduced by etomidate. The heavy outline around Ile-235 indicates modification only in the presence of GABA. B, bars represent log ratios (mean ± S.D. (error bars)) of pCMBS modification rates measured in the presence of maximally activating GABA (>10 × EC50) to the rate without GABA (n ≥ 3 for each condition). *, rates in the presence versus absence of GABA differ significantly with p < 0.05. †, a ratio for I235C could not be calculated because no modification was evident without GABA. C, bars represent log ratios (mean ± S.D.) of pCMBS modification rates measured in the presence of maximally activating GABA plus etomidate (30–100 μm) to rates in the presence of GABA alone (n ≥ 3 for each condition). Black bars, reduced rates; white bars, increased rates. *, rates in the presence versus absence of etomidate differ significantly with p < 0.05.
FIGURE 6.
FIGURE 6.
Etomidate effects on cysteine modification in GABAA receptors with α1Q229C, α1L232C, and α1T237C mutations. Left-hand panels display current traces from oocytes expressing mutant GABAA receptors. Currents were activated with GABA, indicated by solid black bars above each trace. Downward arrows indicate exposures to pCMBS alone or with GABA or with GABA plus etomidate, followed by washout. Modification conditions (P, pCMBS; G, GABA; E, etomidate) for each set of traces are indicated in micromolar above each set of arrows. Right-hand panels show normalized peak current data from the traces shown on the left plotted against cumulative pCMBS exposure (s × mm). Lines through plotted symbols represent least squares fits to single exponentials. A, α1Q229Cβ2γ2L channels. Currents were stimulated with 50 μm GABA (EC10). B, solid squares, modification with pCMBS alone (fitted rate = 520 m−1 s−1); open squares, modification with pCMBS plus GABA (fitted rate = 3280 m−1 s−1); crossed squares, modification with pCMBS plus GABA and etomidate (fitted rate = 6500 m−1 s−1). Inset, rate analyses are shown with a magnified time base. C, α1L232Cβ2γ2L channels. Currents were stimulated with 1 mm GABA (EC100). D, solid triangles, modification with pCMBS plus GABA (fitted rate = 170 m−1 s−1); open triangles, modification with pCMBS plus GABA and etomidate (fitted rate = 34 m−1 s−1). E, α1T237β2γ2L channels. Currents were stimulated with 1 mm GABA (EC100). F, solid circles, modification with pCMBS plus GABA (fitted rate = 1450 m−1 s−1); open circles, modification with pCMBS plus GABA and etomidate (fitted rate = 210 m−1 s−1).
FIGURE 7.
FIGURE 7.
Etomidate docked within an α1β2γ2L GABAA receptor homology model contacts α1Leu-232, α1Met-236, and α1Thr-237 in the M1 domain. A–C, multiple views of a homology model of GABAA receptor built on the structure of pentameric GLIC (Protein Data Bank entry 3P50), showing α-helices as cylinders and β-sheets as ribbons with subunits α1 (yellow), β2 (blue), and γ2L (green). The GABAA receptor-specific ligands GABA (blue), a benzodiazepine (magenta), and etomidate (red) are shown within their intersubunit binding sites as Connolly surfaces. A, the model viewed parallel to the membrane. The extent of the α1-M1 helix examined in this study is colored brown. B, a view from the extracellular space of the extracellular domains. C, a view from the extracellular space of the transmembrane domains. D–F, enlarged views of one etomidate site. Shown in stick format are residues protected by etomidate from pCMBS modification after cysteine substitution, α1Leu-232 (red), α1Met-236 (purple), and α1Thr-237 (green). Also shown in stick format color-coded by atom type (gray, carbon; red, oxygen; blue, nitrogen; gold, sulfur) are residues of interest in the β2 subunit and etomidate docked at its lowest energy orientation. A Connolly surface of the composite of 100 most stable docked poises surrounds the etomidate molecule. D, a view from within the membrane. E, a view from the β2 subunit. F, a view from the synaptic end of the transmembrane domain.

Similar articles

Cited by

References

    1. Franks N. P. (2008) General anaesthesia. From molecular targets to neuronal pathways of sleep and arousal. Nat. Rev. Neurosci. 9, 370–386 - PubMed
    1. Olsen R. W., Sieghart W. (2008) International Union of Pharmacology. LXX. Subtypes of γ-aminobutyric acid(A) receptors. Classification on the basis of subunit composition, pharmacology, and function. Update. Pharmacol. Rev. 60, 243–260 - PMC - PubMed
    1. Baumann S. W., Baur R., Sigel E. (2002) Forced subunit assembly in α1β2γ2 GABAA receptors. Insight into the absolute arrangement. J. Biol. Chem. 277, 46020–46025 - PubMed
    1. Jurd R., Arras M., Lambert S., Drexler B., Siegwart R., Crestani F., Zaugg M., Vogt K. E., Ledermann B., Antkowiak B., Rudolph U. (2003) General anesthetic actions in vivo strongly attenuated by a point mutation in the GABAA receptor β3 subunit. FASEB J. 17, 250–252 - PubMed
    1. Reynolds D. S., Rosahl T. W., Cirone J., O'Meara G. F., Haythornthwaite A., Newman R. J., Myers J., Sur C., Howell O., Rutter A. R., Atack J., Macaulay A. J., Hadingham K. L., Hutson P. H., Belelli D., Lambert J. J., Dawson G. R., McKernan R., Whiting P. J., Wafford K. A. (2003) Sedation and anesthesia mediated by distinct GABAA receptor isoforms. J. Neurosci. 23, 8608–8617 - PMC - PubMed

Publication types

MeSH terms

LinkOut - more resources