Multicenter Study
. 2013 Dec;8(12):2043-52.
doi: 10.2215/CJN.03510413. Epub 2013 Sep 5.

Association of elevated urinary concentration of renin-angiotensin system components and severe AKI

Collaborators, Affiliations
Multicenter Study

Association of elevated urinary concentration of renin-angiotensin system components and severe AKI

Joseph L Alge et al. Clin J Am Soc Nephrol. 2013 Dec.

Abstract

Background: Prognostic biomarkers that predict the severity of AKI at an early time point are needed. Urinary angiotensinogen was recently identified as a prognostic AKI biomarker. The study hypothesis is that urinary renin could also predict AKI severity and that in combination angiotensinogen and renin would be a strong predictor of prognosis at the time of AKI diagnosis.

Design, setting, participants, & measurements: In this multicenter, retrospective cohort study, urine was obtained from 204 patients who developed AKI after cardiac surgery from August 2008 to June 1, 2012. All patients were classified as having Acute Kidney Injury Network (AKIN) stage 1 disease by serum creatinine criteria at the time of sample collection. Urine output was not used for staging. Urinary angiotensinogen and renin were measured, and the area under the receiver-operating characteristic curve (AUC) was used to test for prediction of progression to AKIN stage 3 or in-hospital 30-day mortality. These biomarkers were added stepwise to a clinical model, and improvement in prognostic predictive performance was evaluated by category free net reclassification improvement (cfNRI) and chi-squared automatic interaction detection (CHAID).

Results: Both the urinary angiotensinogen-to-creatinine ratio (uAnCR; AUC, 0.75; 95% confidence interval [CI], 0.65 to 0.85) and the urinary renin-to-creatinine ratio (uRenCR; AUC, 0.70; 95% CI, 0.57 to 0.83) predicted AKIN stage 3 or death. Addition of uAnCR to a clinical model substantially improved prediction of the outcome (AUC, 0.85; cfNRI, 0.673), augmenting sensitivity and specificity. Further addition of uRenCR increased the sensitivity of the model (cfNRI(events), 0.44). CHAID produced a highly accurate model (AUC, 0.91) and identified the combination of uAnCR >337.89 ng/mg and uRenCR >893.41 pg/mg as the strongest predictors (positive predictive value, 80.4%; negative predictive value, 90.7%; accuracy, 90.2%).

Conclusion: The combination of urinary angiotensinogen and renin predicts progression to very severe disease in patients with early AKI after cardiac surgery.


Figures

Figure 1.
Figure 1.
Univariate receiver-operating characteristic (ROC) curves for the outcome of Acute Kidney Injury Network stage 3 AKI or death. Clinical variables Cleveland Clinic score (A) and percentage increase in serum creatinine (sCr) (B) at the time of sample collection, as well as the biomarkers urinary angiotensinogen-to-creatinine ratio (C) and urinary renin-to-creatinine ratio (D) were tested for the ability to predict the outcome. The diagonal gray line shows the line of identity for between the true-positive (sensitivity) and false-positive (1−specificity) rates of the test and has an area under the ROC curve (AUC) of 0.5. Variables were considered predictive if the AUC was >0.5 and the 95% confidence interval (CI) did not overlap 0.5.
Figure 2.
Figure 2.
Urinary angiotensinogen and renin improve prediction of a clinical model for the outcome of Acute Kidney Injury Network stage 3 AKI or death. (A) Receiver-operating characteristic (ROC) curves are shown for the clinical model (includes Cleveland Clinic score and percentage change in serum creatinine at the time of sample collection), the clinical model plus angiotensinogen (uAnCR), and the clinical model plus uAnCR plus urinary renin (uRenCR). ROC curves were considered statistically significant if the 95% CI of the area under the ROC curve (AUC) did not overlap 0.5. (B–E) Scatterplots show the improvement in risk prediction gained by adding (B and C) uAnCR and (D and E) uRenCR to the multivariate clinical model. The diagonal gray line represents the line of identity, which indicates no change in the calculated risk between the model before and after addition of the biomarker. Data points represent the calculated risks for individual patients using the two models being compared. If the data point lies below the line of identity, addition of the biomarker lowers this patient’s calculated risk, whereas if the data point is above the line of identity, the addition of the biomarker increases the calculated risk. Addition of uAnCR to the clinical model resulted in a net lower calculated risk for (B) patients who did not meet the combined outcome (nonevents; category free net reclassification improvement [cfNRI] nonevents, 0.39) and a net higher calculated risk for (C) patients who did meet the outcome (events; cfNRI events, 0.28). Addition of uRenCR to the clinical model plus uAnCR resulted in a net higher calculated risk for (E) patients who met the outcome (events; cfNRI events, 0.44) and a modest net lower risk for (D) patients who did not meet the outcome (nonevents; cfNRI nonevents, 0.11). The integrated sensitivity and specificity plots (F and G) show the improvement in sensitivity and specificity gained by addition of the biomarkers. Addition of uAnCR to the clinical model resulted in a gain of both sensitivity (F) and specificity (G), while addition of uRenCR to the clinical model plus uAnCR increased sensitivity (F) but did not alter specificity (G).
Figure 3.
Figure 3.
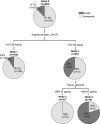
Classification tree for the outcome of Acute Kidney Injury Network 3 AKI or death. Chi-squared automatic interaction detection (CHAID) was used to grow the classification tree using the following covariates: Cleveland Clinic score, percentage increase in serum creatinine at the time of sample collection, urinary angiotensinogen-to-creatinine ratio (uAnCR), and urinary renin-to-creatinine ratio (uRenCR). Statistical significance was determined using the chi-squared test. Interactions between covariates and the outcome were deemed statistically significant if P<0.05 with Bonferroni correction. Pie charts represent the proportion of patients who met the outcome (events) or not (nonevents) at each node of the tree. The model only used uAnCR and uRenCR to predict the outcome, and so the truncated version of classification tree in Supplemental Figure 1 is shown here. An overall accuracy of 90.2% (misclassification risk estimate ± SEM, 0.132±0.024) was obtained by classifying each patient using the uAnCR and uRenCR cutoffs reported above.
Figure 4.
Figure 4.
Receiver-operating characteristic curves (ROCs) for prediction of Acute Kidney Injury Network stage 3 AKI or death. The ROC curves of two multivariate models, a chi-squared automatic interaction detection (CHAID) classification tree, and a multivariate logistic regression model are shown. Both models included four variables: Cleveland clinic score, percentage increase in serum creatinine from baseline that had occurred, urinary angiotensinogen-to-creatinine ratio, and urinary renin-to-creatinine ratio. The ROC curve for the multivariate logistic regression (MLR) is also displayed in Figure 2A, where it is titled clinical model plus uAnCR plus uRenCR. The CHAID classification tree model was the best predictor (P=0.02 compared with the multivariate logistic regression model).

References

    1. Chertow GM, Burdick E, Honour M, Bonventre JV, Bates DW: Acute kidney injury, mortality, length of stay, and costs in hospitalized patients. J Am Soc Nephrol 16: 3365–3370, 2005 - PubMed
    1. Ricci Z, Cruz D, Ronco C: The RIFLE criteria and mortality in acute kidney injury: A systematic review. Kidney Int 73: 538–546, 2008 - PubMed
    1. Zhou J, Yang L, Zhang K, Liu Y, Fu P: Risk factors for the prognosis of acute kidney injury under the acute kidney injury network definition: A retrospective, multicenter study in critically ill patients. Nephrology (Carlton) 17: 330–337, 2012 - PubMed
    1. Uchino S, Bellomo R, Goldsmith D, Bates S, Ronco C: An assessment of the RIFLE criteria for acute renal failure in hospitalized patients. Crit Care Med 34: 1913–1917, 2006 - PubMed
    1. Bellomo R, Ronco C, Kellum JA, Mehta RL, Palevsky P: Acute Dialysis Quality Initiative workgroup: Acute renal failure - definition, outcome measures, animal models, fluid therapy and information technology needs: The second international consensus conference of the acute dialysis quality initiative (ADQI) group. Crit Care 8: R204–R212, 2004 - PMC - PubMed

Publication types

MeSH terms