. 2014 Jan;25(1):43-54.
doi: 10.1681/ASN.2012090962. Epub 2013 Sep 5.

Cysteamine modulates oxidative stress and blocks myofibroblast activity in CKD

Affiliations

Cysteamine modulates oxidative stress and blocks myofibroblast activity in CKD

Daryl M Okamura et al. J Am Soc Nephrol. 2014 Jan.

Abstract

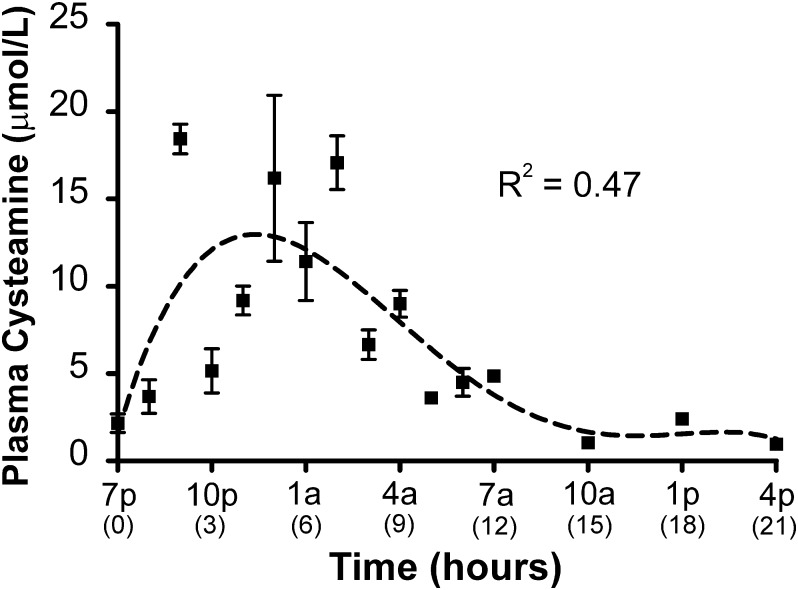
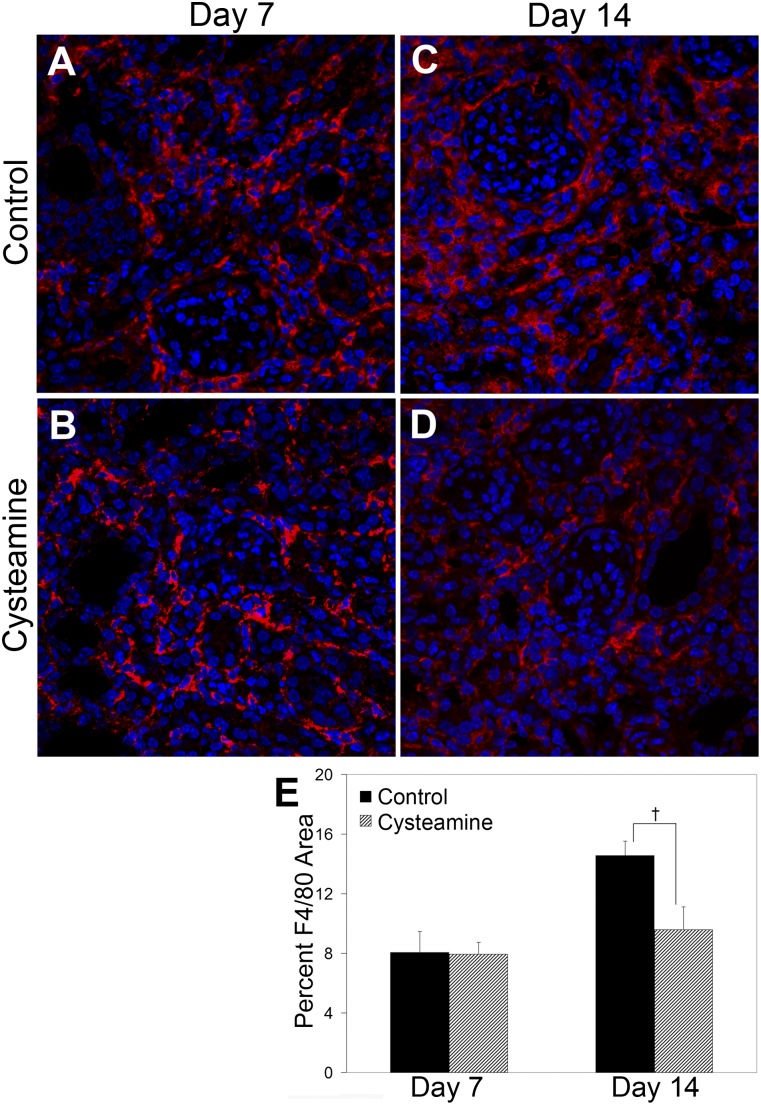
Therapy to slow the relentless expansion of interstitial extracellular matrix that leads to renal functional decline in patients with CKD is currently lacking. Because chronic kidney injury increases tissue oxidative stress, we evaluated the antifibrotic efficacy of cysteamine bitartrate, an antioxidant therapy for patients with nephropathic cystinosis, in a mouse model of unilateral ureteral obstruction. Fresh cysteamine (600 mg/kg) was added to drinking water daily beginning on the day of surgery, and outcomes were assessed on days 7, 14, and 21 after surgery. Plasma cysteamine levels showed diurnal variation, with peak levels similar to those observed in patients with cystinosis. In cysteamine-treated mice, fibrosis severity decreased significantly at 14 and 21 days after unilateral ureteral obstruction, and renal oxidized protein levels decreased at each time point, suggesting reduced oxidative stress. Consistent with these results, treatment of cultured macrophages with cysteamine reduced cellular generation of reactive oxygen species. Furthermore, treatment with cysteamine reduced α-smooth muscle actin-positive interstitial myofibroblast proliferation and mRNA levels of extracellular matrix proteins in mice and attenuated myofibroblast differentiation and proliferation in vitro, but did not augment TGF-β signaling. In a study of renal ischemia reperfusion, cysteamine therapy initiated 10 days after injury and continued for 14 days decreased renal fibrosis by 40%. Taken together, these data suggest previously unrecognized antifibrotic actions of cysteamine via TGF-β-independent mechanisms that include oxidative stress reduction and attenuation of the myofibroblast response to kidney injury and support further investigation into the potential benefit of cysteamine therapy in the treatment of CKD.


Figures

Figure 1.
Figure 1.
Plasma cysteamine levels. Mice are given free access to drinking water containing cysteamine, calculated to deliver a cysteamine dose of 600 mg/kg, for a run-in period of 3 days, after which plasma levels are serially measured in mice hourly between 7 pm and 7 am, and every 3 hours from 7 am to 7 pm (n=4 per group). A nonlinear fit of data is performed on the entire data set starting from 7 pm. Results are shown as the mean ± 1 SEM.
Figure 2.
Figure 2.
Fibrosis severity is attenuated in cysteamine-treated mice. (A) Total kidney collagen content, measured using the hydroxyproline assay, is significantly decreased in the obstructed kidneys of the cysteamine-treated mice (hatched bars) compared with controls (solid bars) on days 14 and 21 (n=8 mice per group). (B) The graph summarizes the results of picrosirius red–positive interstitial collagen quantification, with representative light photomicrographs (C and D) that confirmed diminished matrix deposition at days 14 and 21 in cysteamine-treated mice (n=6 per group). Results are expressed as the mean ± SEM. P<0.01; P<0.05, control versus cysteamine-treated groups. Original magnification, ×400 in C and D.
Figure 3.
Figure 3.
Oxidative stress is reduced with cysteamine treatment. Tissue from UUO and contralateral (contra) kidneys is homogenized in cold modified radioimmunoprecipitation assay buffer with inhibitors of thiol oxidation. Total kidney thiols (A) and carbonyl proteins (B) are measured and normalized to total protein. Black squares represent control mice and black triangles represent cysteamine-treated mice. Results are expressed as the mean ± SEM. P<0.05, control versus cysteamine-treated groups. NS, not significant.
Figure 4.
Figure 4.
Kidney transglutaminase activity is unaltered by cysteamine therapy. Transglutaminase activity, measured in total kidney homogenates, does not show any significant differences (n=6 per group). Solid bars represent control mice and hatched bars represent cysteamine-treated mice. Results are expressed as the mean ± SEM. Contra, contralateral unobstructed kidney; NS, not significant.
Figure 5.
Figure 5.
Macrophage infiltration is diminished in cysteamine-treated mice. (A–D) Representative confocal images illustrate F4/80-stained interstitial cells. (E) The graph summarizes the semiquantitative results of F4/80+ interstitial staining (n=8 per group). F4/80 (red), nuclei (blue). Results are expressed as the mean ± SEM. P<0.01, control versus cysteamine-treated groups. NS, not significant. Original magnification, ×400.
Figure 6.
Figure 6.
ROS generation is diminished with cysteamine treatment in two in vitro models of oxidant stress. (A) Phorbol-induced oxidant stress. RAW macrophages are incubated with or without cysteamine for 60 minutes before the addition of 10 μM of PMA and the chemiluminescence agent. The graph summarizes the results of extracellular ROS released (n=4–6 per group). (B–D) Apoptotic cell phagocytosis-induced oxidant stress. Thioglycollate-elicited mouse peritoneal macrophages are cultured with or without cysteamine for 24 hours. Late-stage apoptotic tubular cells are generated by irradiating mouse cortical tubular cells and cocultured with control or cysteamine-treated peritoneal macrophages for 24 hours before being treated with CellRox (green). Nuclei are counterstained with TO-PRO (blue). (B) The graph summarizes the semiquantitative results of mean macrophage oxidant species. (C and D) Representative macrophage oxidation images are shown for control and cysteamine-treated macrophages. P<0.01; P<0.05, control versus cysteamine-treated groups. RLU, relative light unit; MCT, mouse cortical tubular cell.
Figure 7.
Figure 7.
Interstitial myofibroblast accumulation is attenuated with cysteamine treatment. (A and B) Representative αSMA-stained confocal images are shown for day 14 UUO. (C) The graph summarizes the semiquantitative results of the analysis of the tubulointerstitial area expressing αSMA protein (n=7–8 per group). (D–F) The graphs show the results of analysis of kidney ECM mRNA levels, measured by semiquantitative real-time PCR and normalized to two housekeeping genes, 18S and GAPDH. (D) Fibronectin. (E) Procollagen I. (F) Procollagen III. Results are expressed as the mean ± SEM. P<0.01; P<0.05, control versus cysteamine-treated groups. Original magnification, ×400.
Figure 8.
Figure 8.
Myofibroblast proliferation is decreased in cysteamine-treated mice. (A and B) Mice are injected with BrdU the day before euthanasia. Representative immunohistochemical photomicrographs on the left illustrate BrdU+ cells identified by the brown stain; nuclei are counterstained with hematoxylin. (C) The graph summarizes the results of the semiquantitative analysis of the number of proliferating BrdU+ tubulointerstitial cells (n=5–8 per group). (D and E) Dual staining confocal microscopy is performed with anti-αSMA (green) and anti-Ki67 (red) primary antibodies and magnified photomicrographs are shown on the right. The number of double-positive cells (arrow) is counted in six randomly selected fields from each experimental animal (n=8 animals per group). (F) The lower right graph summarizes the results, showing the significant differences in the total number of Ki67+ cells and Ki67 plus αSMA+ cells. All results are expressed as the mean ± SEM. P<0.01; P<0.05, control versus cysteamine-treated groups. NS, not significant. Original magnification, ×200 in A and B; ×400 in D and E.
Figure 9.
Figure 9.
Cysteamine blocks both myofibroblast proliferation and activation. Normal rat kidney fibroblasts (NRK-49F) are transformed into αSMA+ myofibroblasts by exposure to TGF-β. For proliferation experiments, cells are placed in growth media plus TGF-β with cysteamine or vehicle alone. (A and B) The graphs show the number of myofibroblasts and illustrate significantly reduced proliferation rates with cysteamine treatment at both 24 hours (A) and 48 hours (B). (C) Representative FACS plots illustrate similar numbers of viable NRK-49F cells after cysteamine exposure, as measured by reaction with the polyanionic dye calcein and FACS analysis (n=3 per group). (D) Mouse proximal tubular cells incubated in growth media in the absence (0 nM) or presence of cysteamine (0.5 and 2 nM) show similar proliferation rates at 24 hours (n=6). (E) The graph summarizes the results of effects of cysteamine on the differentiation of NRK-49F fibroblasts into α SMA+ myofibroblasts as assessed by mRNA levels measured by semiquantitative real-time PCR and protein levels measured by Western blotting (n=4 per group). (F) A representative αSMA Western blot. Results are expressed as the mean ± SEM. P<0.01; P<0.05, control versus cysteamine-treated cells. NS, not significant.
Figure 10.
Figure 10.
Cysteamine blocks pericyte-derived myofibroblast proliferation. PDGFR-β+ pericytes are isolated from normal mouse kidneys and cultured in the presence of TGF-β in growth media with or without cysteamine for 24 hours; cells are treated with BrdU before fixation. (A and B) Representative fluorescent images of control and cysteamine-treated pericyte-derived myofibroblasts. BrdU (red), nuclei (blue). White arrowheads highlight double-positive cells. (C) The graph summarizes the semiquantitative results of BrdU+ proliferating myofibroblasts. Results are expressed as the mean ± SEM. P<0.01, control versus cysteamine-treated cells. NS, not significant,
Figure 11.
Figure 11.
Cysteamine attenuates fibrosis progression after AKI. Unilateral IRI is induced. Cysteamine bitartrate is started 10 days after surgery and continues for 14 days until euthanasia. (A) The graph summarizes fibrosis severity after IRI, shown as the total kidney collagen content, measured using the hydroxyproline assay, in the group of cysteamine-treated mice (black triangles) compared with the control group (black squares) (n=5 mice per group). (B) The graph summarizes the results of picrosirius red–positive interstitial collagen quantification, with representative light photomicrographs (D and E) that confirm diminished matrix deposition. (C) The graph summarizes the results of the analysis of kidney ECM mRNA levels, measured by semiquantitative real-time PCR and normalized to two housekeeping genes, 18S and GAPDH. Results are expressed as the mean ± SEM. P<0.05, control versus cysteamine-treated groups. FBN, fibronectin; Col1, procollagen I; Col3, procollagen III. Original magnification, ×400 in D and E.

Comment in

References

    1. Taguchi K, Fujikawa N, Komatsu M, Ishii T, Unno M, Akaike T, Motohashi H, Yamamoto M: Keap1 degradation by autophagy for the maintenance of redox homeostasis. Proc Natl Acad Sci U S A 109: 13561–13566, 2012 - PMC - PubMed
    1. Churchman AT, Anwar AA, Li FY, Sato H, Ishii T, Mann GE, Siow RC: Transforming growth factor-beta1 elicits Nrf2-mediated antioxidant responses in aortic smooth muscle cells. J Cell Mol Med 13: 2282–2292, 2009 - PMC - PubMed
    1. Yoo SK, Starnes TW, Deng Q, Huttenlocher A: Lyn is a redox sensor that mediates leukocyte wound attraction in vivo. Nature 480: 109–112, 2011 - PMC - PubMed
    1. Latchoumycandane C, Marathe GK, Zhang R, McIntyre TM: Oxidatively truncated phospholipids are required agents of tumor necrosis factor α (TNFα)-induced apoptosis. J Biol Chem 287: 17693–17705, 2012 - PMC - PubMed
    1. Okamura DM, Himmelfarb J: Tipping the redox balance of oxidative stress in fibrogenic pathways in chronic kidney disease. Pediatr Nephrol 24: 2309–2319, 2009 - PubMed

Publication types

MeSH terms