

Effective harmonic potentials: insights into the internal cooperativity and sequence-specificity of protein dynamics
- PMID: 24009495
- PMCID: PMC3757084
- DOI: 10.1371/journal.pcbi.1003209
Effective harmonic potentials: insights into the internal cooperativity and sequence-specificity of protein dynamics
Abstract
The proper biological functioning of proteins often relies on the occurrence of coordinated fluctuations around their native structure, or on their ability to perform wider and sometimes highly elaborated motions. Hence, there is considerable interest in the definition of accurate coarse-grained descriptions of protein dynamics, as an alternative to more computationally expensive approaches. In particular, the elastic network model, in which residue motions are subjected to pairwise harmonic potentials, is known to capture essential aspects of conformational dynamics in proteins, but has so far remained mostly phenomenological, and unable to account for the chemical specificities of amino acids. We propose, for the first time, a method to derive residue- and distance-specific effective harmonic potentials from the statistical analysis of an extensive dataset of NMR conformational ensembles. These potentials constitute dynamical counterparts to the mean-force statistical potentials commonly used for static analyses of protein structures. In the context of the elastic network model, they yield a strongly improved description of the cooperative aspects of residue motions, and give the opportunity to systematically explore the influence of sequence details on protein dynamics.
Conflict of interest statement
The authors have declared that no competing interests exist.
Figures
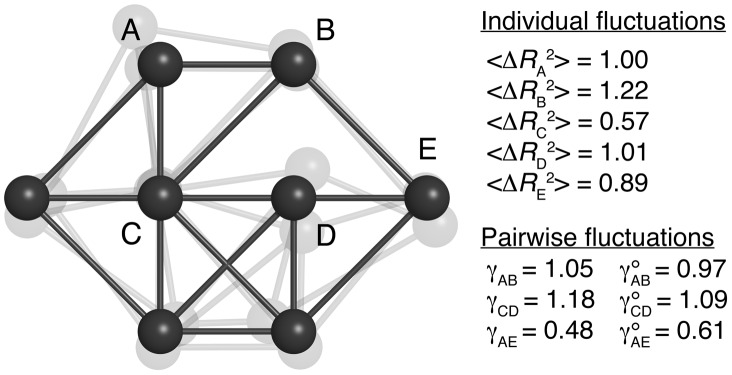
 integration steps under Gaussian noise. Selected values of
  ,
,  and
and  are given in arbitrary units. Individually, the pairs A–B and C–D would be identical, but they experience differently the influence of the other beads. As a result, the C–D pair is effectively more rigid than A–B (
 ). In both cases, the motions are somewhat correlated, as the apparent stiffness
  is larger than what is expected from the knowledge of their individual motions (
 ). Beads A and E do not interact directly but the effect of the network on their relative motions is captured by the values of
  and
and  .
.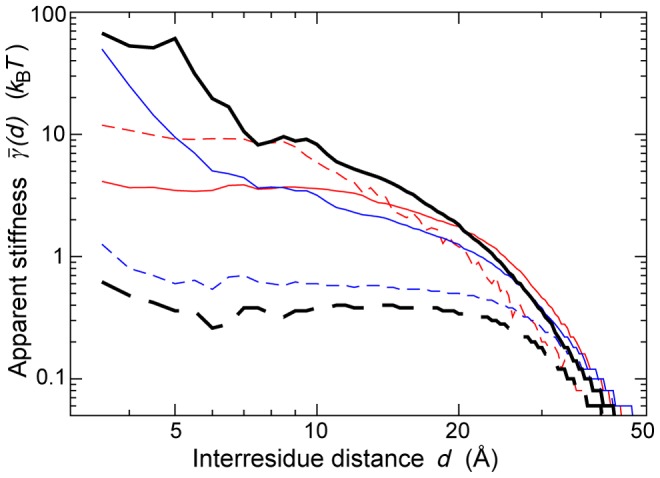
 (continuous black) and
  (dashed black), extracted from the dataset of 1500 NMR ensembles. Values of
  predicted on the same dataset by the
  (dashed red);
  (continuous red);
  (dashed blue);
  (continuous blue).
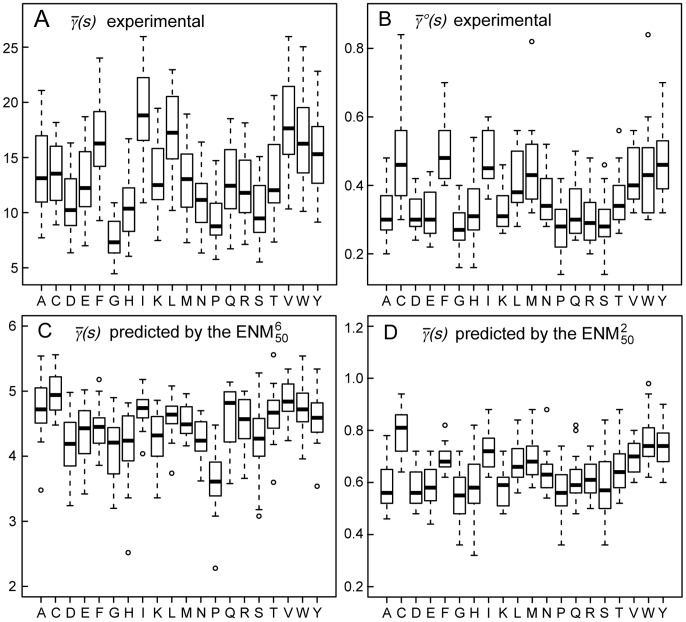
 over the 20 possible partners is given in units of
  , along with the maximal, minimal,
  and
and  quartile values. Outliers from these distributions are depicted as circles. (A) Experimental values of
  , extracted from the dataset of 1500 NMR ensembles. (B) Experimental values of
  , extracted from the same dataset. (C) Values of
  predicted by the
  , on the same dataset. (D) Values of
  predicted by the
  , on the same dataset.
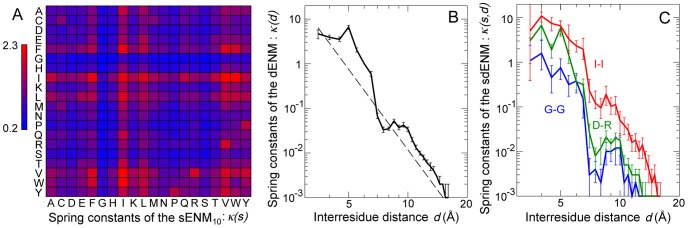
 , for the 210 amino acid pairs. (B) Spring constants of the dENM. The dashed line corresponds to
  . (C) Spring constants of the sdENM for 3 amino-acid pairs. The error bars in panels B–C correspond to the bootstrap estimates of the 90% confidence intervals (see Methods). All
  values are given in Tables S2, S3, S4, S5, and in Dataset S1.
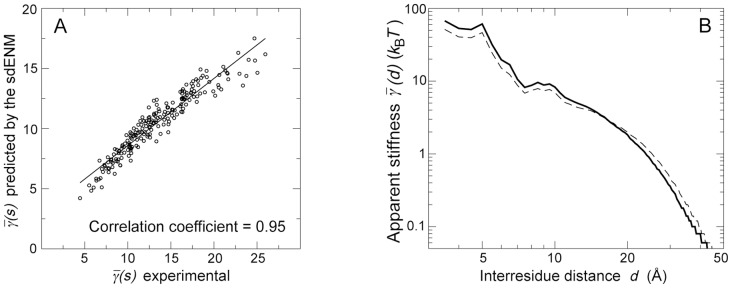
 , in the dataset of 1500 NMR ensembles. The Pearson correlation coefficient between predictions and experimental data is equal to 0.95 (
 ). See also Figures S3 and S5. (B) Experimental (continuous) and predicted (dashed) values of
  , in the dataset of 1500 NMR ensembles. See also Figure S2.
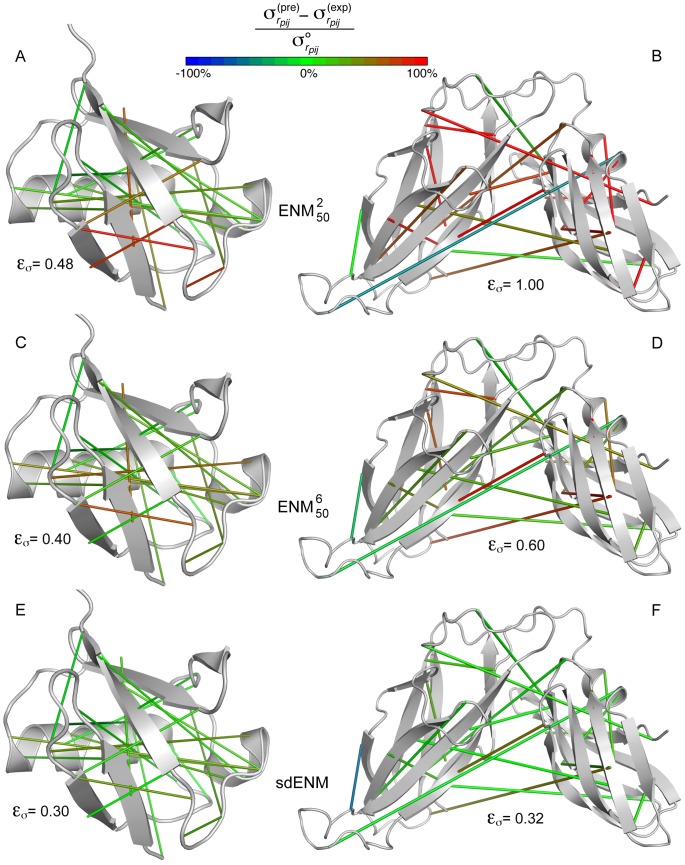
 Å, and 10 with
  Å) are connected by solid lines. A green line indicates that the amplitude of the fluctuations of the interresidue distance is well estimated by the model. A red (blue) line indicates that the amplitude of the fluctuations of the interresidue distance is largely overestimated (underestimated) by the model. Values larger than 100% or lower than −100% are assimilated to 100% and −100%, respectively. In addition, for each protein and each ENM variant, we report the error
  on the estimation of pairwise fluctuations (eq. 15), which accounts for all pairs of residues in the protein. (A,C,E) High quality structural ensemble of ubiquitin, obtained by combining NMR information with molecular dynamics simulations (PDB: 1xqq) . (B,D,F) NMR structural ensemble of periplasmic chaperone FimC (PDB: 1bf8). The relatively rigid orientation of the two domains is ensured by specific interdomain interactions . (A–B)
  . (C–D)
  . (E–F)
  .
.References
-
- Takada S (2012) Coarse-grained molecular simulations of large biomolecules. Curr Opin Struct Biol 22: 130–137. - PubMed
-
- Tama F, Brooks CL (2006) Symmetry, form, and shape: guiding principles for robustness in macromolecular machines. Annu Rev Biophys Biomol Struct 35: 115–33. - PubMed
-
- Atilgan C, Okan OB, Atilgan AR (2012) Network-based models as tools hinting at nonevident protein functionality. Annu Rev Biophys 41: 205–25. - PubMed
MeSH terms
Substances
LinkOut - more resources
Full Text Sources
Other Literature Sources
