. 2013;9(8):e1003580.
doi: 10.1371/journal.ppat.1003580. Epub 2013 Aug 29.

Polydnaviral ankyrin proteins aid parasitic wasp survival by coordinate and selective inhibition of hematopoietic and immune NF-kappa B signaling in insect hosts

Affiliations

Polydnaviral ankyrin proteins aid parasitic wasp survival by coordinate and selective inhibition of hematopoietic and immune NF-kappa B signaling in insect hosts

Gwenaelle Gueguen et al. PLoS Pathog. 2013.

Abstract

Polydnaviruses are mutualists of their parasitoid wasps and express genes in immune cells of their Lepidopteran hosts. Polydnaviral genomes carry multiple copies of viral ankyrins or vankyrins. Vankyrin proteins are homologous to IκB proteins, but lack sequences for regulated degradation. We tested if Ichnoviral Vankyrins differentially impede Toll-NF-κB-dependent hematopoietic and immune signaling in a heterologous in vivo Drosophila, system. We first show that hematopoiesis and the cellular encapsulation response against parasitoid wasps are tightly-linked via NF-κB signaling. The niche, which neighbors the larval hematopoietic progenitors, responds to parasite infection. Drosophila NF-κB proteins are expressed in the niche, and non cell-autonomously influence fate choice in basal and parasite-activated hematopoiesis. These effects are blocked by the Vankyrin I²-vank-3, but not by P-vank-1, as is the expression of a NF-κB target transgene. I²-vank-3 and P-vank-1 differentially obstruct cellular and humoral inflammation. Additionally, their maternal expression weakens ventral embryonic patterning. We propose that selective perturbation of NF-κB-IκB interactions in natural hosts of parasitic wasps negatively impacts the outcome of hematopoietic and immune signaling and this immune deficit contributes to parasite survival and species success in nature.


Conflict of interest statement

The authors have declared that no competing interests exist.

Figures

Figure 1
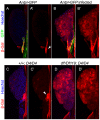
Figure 1. Dif and Dorsal localization in third instar lymph gland.
A–B′. Dorsal is found throughout the anterior lobes of a third instar control (Ubc9/CyO y+) lymph gland. C–D″. Dif signal is high in Antp-positive niche cells of the control (Ubc9/CyO y+) lymph gland. Staining signal was not detected in mutants lacking either gene (not shown). Bars indicate 10 µm.
Figure 2
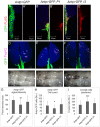
Figure 2. Effect of wasp infection on D4-lacZ expression.
A–A′. Uninfected Antp>GFP animals. D4-lacZ is expressed mostly in the niche (A′, arrowhead) where it colocalizes with Antp>GFP (A, yellow). B–B′. L. boulardi infection triggers four-fold increase in the expression of D4-lacZ (23.06±4.22 versus 89.65±41.4; t = −6.37, df = 14.7, p<0.001; N = 4 glands for uninfected and 8 for infected). D4-lacZ is also activated in cells of the anterior lobes. C–D′. Niche expression of D4-lacZ is abolished in glands lacking a functional dl gene (D, D′), but is observed in controls (C–C′). The reporter is expressed ectopically in the mutant but not control lobe cortex.
Figure 3
Figure 3. Effects of Dif and Dorsal on Antp>GFP expression and on crystal cell number.
(A–E) Antp>GFP expression in third instar lymph glands. A. Control. B. Knockdown of Dif (DifRNAi), or C. Dorsal (dlRNAi). Overexpression of D. Dif (Dif), or E. Dorsal (dl). F. Manipulation of Dif or Dorsal levels does not affect the number of Antp>GFP-positive cells (t = −1.45, df = 6.5, p = 0.19 for Antp>DifRNAi, t = 1.45, df = 4.7, p = 0.21 for Antp>dlRNAi, t = −0.62, df = 6.2, p = 0.55 for Antp>Dif and t = −1.29, df = 6.3, p = 0.24 for Antp>dl). G. Quantification of Antp>GFP expression. The intensity of the GFP signal is reduced in Antp>DifRNAi (t = 3.4, df = 7.8, p = 0.01) and Antp>dlRNAi (t = 7.8, df = 5.6, p<0.001) and increased in Antp>Dif (t = −2.4, df = 8, p = 0.04) and Antp>dl (134.6 versus 216.2 - t = −8.2, df = 5.4, p<0.001), compared to controls, N = 5 animals for each genotype. H–I. Anterior lobes of animals H. heterozygous for the deficiency lacking Dif and dl (Df(2L)TW119/+ or Df(2L)J4/+), and I. Dif/dl mutants (Df(2L)TW119/Df(2L)J4) stained for ProPO2 (magenta, crystal cells). (J–K) Crystal cells (black spots) of third instar, J. heterozygous control, and K. Df(2L)TW119/Df(2L)J4 mutant, visualized by incubation at 70°C. L. The average number of sessile crystal cells in the three posterior segments is significantly increased in Dif dl mutants (t = −3.4, df = 25.9, p = 0.002. N = 20 for heterozygotes; N = 21 for Dif dl mutants). Bars indicate standard deviation. Stars indicate statistical significance relative to controls (* for 0.05<p<0.01, ** for 0.01<p<0.001 and *** for p<0.001).
Figure 4
Figure 4. Vankyrin localization and their effects on niche properties and on crystal cell development.
A–A′. Niche without any Vankyrin expression stained with anti-FLAG antibody. B–B′. Antp-Gal4 simultaneously drives the expression of GFP and P1 from their respective UAS sequences. P1 localizes to nuclei and in the cytoplasm (yellow) where it is relatively uniformly distributed. C–C′. Antp-Gal4 simultaneously drives the expression of GFP and I3 from their respective UAS sequences. I3 is expressed mostly in the cytoplasm; it colocalizes with Antp>GFP expression in some cells (yellow), and its distribution is speckled. D–F1. Effect of Vankyrins on crystal cells development. D–F. Crystal cells in the anterior lobes of the lymph gland. Crystal cell number is not significantly different from the control when either Vankyrin is expressed. D1–F1. However, their number is increased in the three posterior larval segments when I3 is expressed (for quantification, see Panel I.) G. Expression of I3 reduces the number of Antp>GFP-positive cells in the niche compared to controls (W = 438, p = 0.03 while P1 does not (W = 229, p = 0.09). N = 16 animals for control; N = 10 animals for I3 and P1-expressing glands. Cell counts represent an average per niche. H. Expression of I3 decreases the intensity (measurement done on more than 15 cells – see Methods) of Antp>GFP signal. Pixel intensity is reduced in Antp>GFP, I3 (t = 3.3, df = 30.9, p = 0.002) but not in Antp>GFP, P1 (t = 1.9, df = 47.6, p = 0.07) compared to controls (N = 15 animals for Antp>GFP controls, N = 9 animals for I3 expressing animals and N = 10 for P1 expressing animals). I. Quantification of crystal cell changes in panels E1 and F1, relative to D1. Crystal cell number in the three posterior larval segments is increased by Antp>I3 (t = −3.7, df = 65, p<0.001; control, N = 33; I3 expressing animals, N = 34) but not with Antp>P1 (t = −1.7, df = 59.197, p = 0.09 - P1 expressing animals, N = 29). Scale bars represent 20 µm. Bars indicate standard deviation. Stars indicate conditions that are different from controls (* for 0.05<p<0.01, ** for 0.01<p<0.001 and *** for p<0.001).
Figure 5
Figure 5. Effect of Vankyrins on D4-lacZ expression.
A–A″. In uninfected Antp>GFP animals, D4-lacZ reporter is expressed strongly in the niche where it overlaps with Antp>GFP (A′–A″ – same image as in Fig. 2A–A″) and is sometimes found in a few cells in the anterior lobes. Expression of the D4-lacZ reporter is not changed in the niche when P1 is expressed (B–B″) but is clearly reduced by the expression of I3 (C–C″) compared to controls. D–D′. Same image as in Fig. 2B–B″. Infection strongly induces D4-lacZ expression in the niche and cells of the anterior lobes (compare D with A). E–E′. Expression of I3 in infected animals limits the induction of D4-lacZ in cells of the anterior lobes (compare intensity of β-Gal staining in cells of the anterior lobes in E′ versus D′ - t = 5.4, df = 27.1, p<0.001; N = 8 for Antp>GFP animals and N = 12 for Antp>GFP, I3 animals). F. Schematic linking NF-κB activity in the niche to choice of cell fate. Wild type control lymph glands (middle) with moderate NF-κB activity develop the correct proportion of crystal cells (CC), possess few if any constitutive lamellocytes (C, Lam), and abundant wasp-induced lamellocytes (WI Lam). Lack of NF-κB activity (left) shifts hematopoiesis in favor of crystal cells, while constitutive lamellocytes are absent and only a few wasp-induced lamellocytes are specified. High NF-κB (right; achieved either by infection or by genetic activation) shifts hematopoiesis in favor of lamellocytes and discourages crystal cell production.
Figure 6
Figure 6. Vankyrins and GFP-Dorsal localization in blood cells.
A–A″. Uninfected Cg>GFP-Dorsal shows speckled distribution (arrowhead). B–B″. Infected Cg>GFP-Dorsal. Infection relocalizes some GFP-Dorsal to nucleus (arrow). C–C″. Uninfected Srp>GFP, I3. Both I3 (C, arrowhead) and GFP-Dorsal (C′) are mostly cytoplasmic in blood cells of uninfected animals and do not show much co-localization. D–D″ Infected Srp>GFP, I3. In infected animals, I3 is strongly nuclear (D, arrow) but most of the GFP-Dorsal colocalizes with the remaining cytoplasmic I3 (D″ – yellow). E–E″. P1 is also mostly cytoplasmic in cells from uninfected animals (E, E″, arrowhead). F–F″. Upon infection, both GFP-Dorsal and P1 colocalize in the nucleus (F″, white). All images are presented at the same magnification and scale bars represent 20 µm. Cg>GFP-dl, I3 cells from uninfected animals show cytoplasmic localization of both proteins similar to Srp>GFP-dl I3 (data not shown).
Figure 7
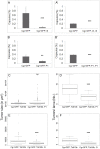
Figure 7. Effect of Vankyrins on wasp-induced encapsulation and tumorogenesis.
A–B′. Decreased encapsulation when expressing Vankyrins. Comparisons are made within experiments to account for variability in percent encapsulation. A–A′. One copy A or two copies A′ of I3 were expressed. In each case, the reduction in encapsulation was significant (X2 = 37.1, df = 1, p<0.001 for Cg>GFP, I3 and X2 = 12.8, df = 1, p<0.001 for Cg>GFP, I3, I3. A. N = 54 for control and N = 46 for I3 expressing animals. A′. N = 94 for control and N = 63 for I3 expressing animals). B–B′. Expression of one B, or two copies B′ of P1 also reduced encapsulation (X2 = 9.8, df = 1, p = 0.002 for Cg>GFP, P1 and X2 = 115, df = 1, p<0.001 for Cg>GFP, P1, P1. B. N = 124 for control and N = 114 for P1 expressing animals. B′. N = 62 for control and N = 64 for P1 expressing animals). Bars indicate standard deviation. Stars indicate conditions that are different from controls (* for 0.05<p<0.01, ** for 0.01<p<0.001 and *** for p<0.001). C–F. Effect of Vankyrins on Toll10b-induced tumorogenesis. C–D. Effect of P1 on C. average tumor size per larva (Wilcoxon test W = 8619, p = 0.04) and D. average number of tumors per larva (t = −4.42, df = 21.6, p<0.001. N = 24 for control and N = 31 for P1 expressing animals). E–F. Effect of I3 on E. average tumor size (t = 53.7, df = 28, p<0.001) and F. average number of tumors per larva (W = 405.5, p<0.001. N = 21 for control and N = 24 for I3 expressing animals). Data are based on three independent experiments. Bars indicate standard deviation. Stars indicate conditions that are different from controls (* for 0.05<p<0.01, ** for 0.01<p<0.001 and *** for p<0.001).
Figure 8
Figure 8. Effect of Vankyrins on immune gene expression.
A. Both Vankyrins strongly reduce the expression of Drosomycin in manually-poked larvae (t = 4.1, df = 6, p = 0.006 for Cg>GFP, P1 and t = 4, df = 5, p = 0.009 for Cg>GFP, I3). B–B′. Levels of ProPO transcripts are increased in Cg>GFP, Toll10b animals compared to controls (t = 14.2, df = 5, p<0.001 for ProPO59 and t = 11.2, df = 3, p = 0.001 for ProPO54). B. ProPO59 expression level is reduced to control levels by expression of I3 (Cg>GFP, Toll10b, I3) (t = 3.4, df = 6, p = 0.01 compared to Cg>GFP, Toll10b and t = 0.4, df = 5, p = 0.7 compared to Cg>GFP). Expression of P1 (Cg>GFP, Toll10b, P1) also decreases (t = 6.9, df = 6, p<0.001 compared to Cg>GFP, Toll10b and t = 1.96, df = 5, p = 0.1 compared to controls) the expression of ProPO59 to control levels. B′. The levels of ProPO54 transcripts are only affected by I3 expression (Cg>GFP, Toll10b, I3) (t = 5.1, df = 5, p = 0.003) but not by P1 expression (Cg>GFP, Toll10b, P1) (t = 0.5, df = 5, p = 0.6). Stars indicate conditions that are different from controls (* for 0.05<p<0.01, ** for 0.01<p<0.001 and *** for p<0.001).
Figure 9
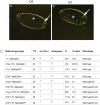
Figure 9. Vankyrins enhance maternal dorsal haplo-insufficiency in early embryonic development.
A–B. Phenotypes of dorsalized embryos imaged in dark field. A. Embryo with weak dorsalization defects (D4). B. Embryo with somewhat stronger dorsalization showing reduction of ventral denticle belts (D3). Arrows point to the filzkorper. Arrowheads point to the ventral setae. Neither D4 not D3 embryos hatch. C. Percentage of hatching embryos for each maternal genotype and associated phenotypes. Maternal genetic background for the dl locus was either wild type or heterozygous dl1/+. A significant decrease in the percentage of hatching was observed for animals expressing two copies of either P1 (t = 5.5, df = 2.37, p = 0.02) or I3 (t = 4.02, df = 2.6, p = 0.036) compared to embryos from dl1/+ control females at 29°C. The percentages were not significantly affected when only one copy was expressed (t = −1.9, df = 4.69, p = 0.12 for P1 and t = −2.9, df = 2.3, p = 0.087 for I3). N represents the total number of fertilized embryos analyzed; unfertilized embryos were not included. Stars indicate conditions that are different from controls (* for 0.05<p<0.01, ** for 0.01<p<0.001 and *** for p<0.001).

Similar articles

Cited by

References

    1. Lee MJ, Kalamarz ME, Paddibhatla I, Small C, Rajwani R, et al. (2009) Virulence factors and strategies of Leptopilina spp.: selective responses in Drosophila hosts. Adv Parasitol 70: 123–145. - PMC - PubMed
    1. Paddibhatla I, Lee MJ, Kalamarz ME, Ferrarese R, Govind S (2010) Role for sumoylation in systemic inflammation and immune homeostasis in Drosophila larvae. PLoS Pathog 6: e1001234. - PMC - PubMed
    1. Schlenke TA, Morales J, Govind S, Clark AG (2007) Contrasting infection strategies in generalist and specialist wasp parasitoids of Drosophila melanogaster. PLoS Pathog 3: 1486–1501. - PMC - PubMed
    1. Krzemien J, Crozatier M, Vincent A (2010) Ontogeny of the Drosophila larval hematopoietic organ, hemocyte homeostasis and the dedicated cellular immune response to parasitism. Int J Dev Biol 54: 1117–1125. - PubMed
    1. Lanot R, Zachary D, Holder F, Meister M (2001) Postembryonic hematopoiesis in Drosophila. Dev Biol 230: 243–257. - PubMed

Publication types

LinkOut - more resources