

Replica exchange improves sampling in low-resolution docking stage of RosettaDock
- PMID: 24009670
- PMCID: PMC3756964
- DOI: 10.1371/journal.pone.0072096
Replica exchange improves sampling in low-resolution docking stage of RosettaDock
Abstract
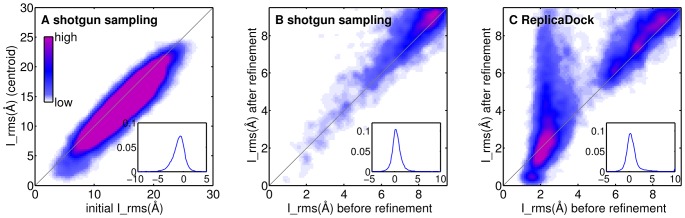
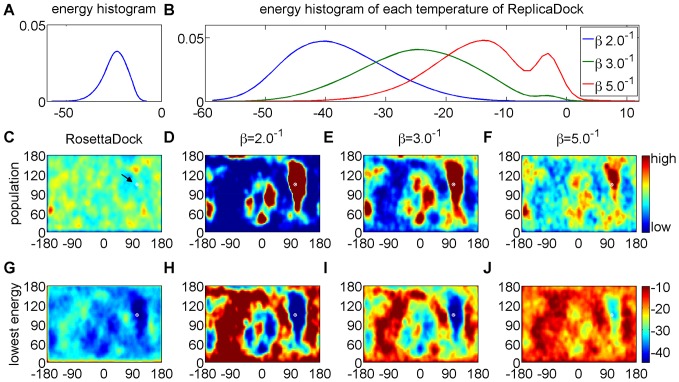
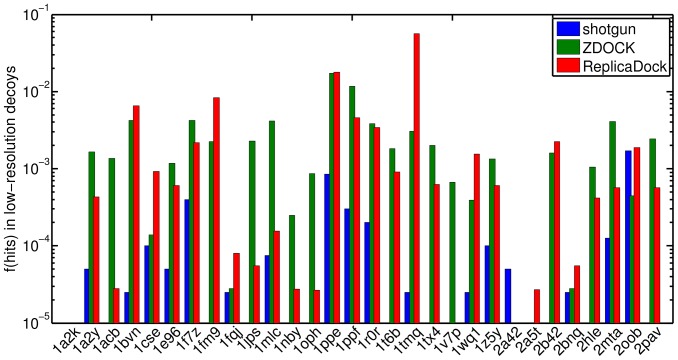
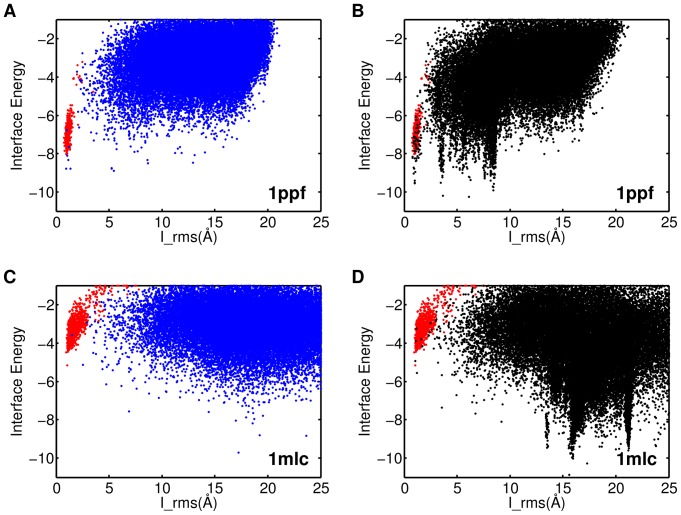
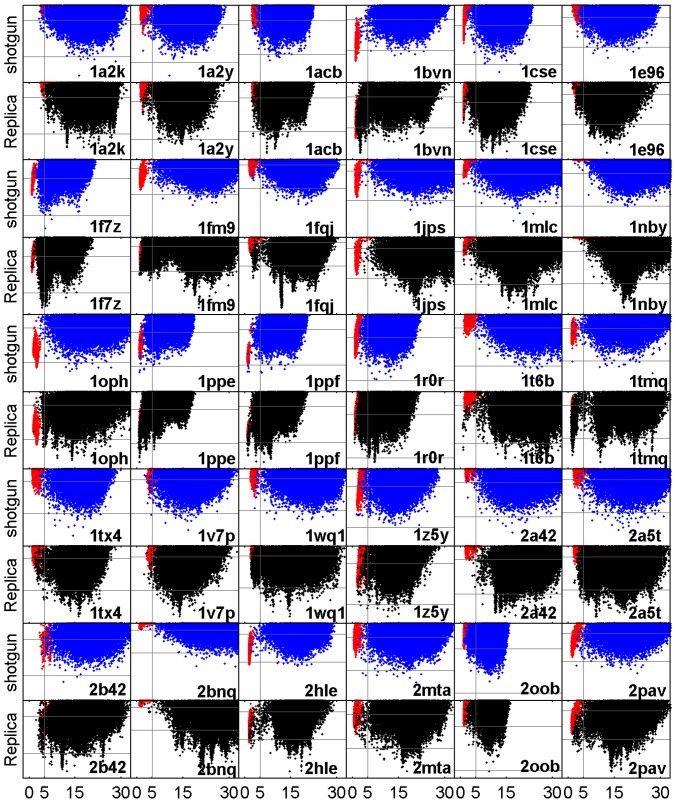
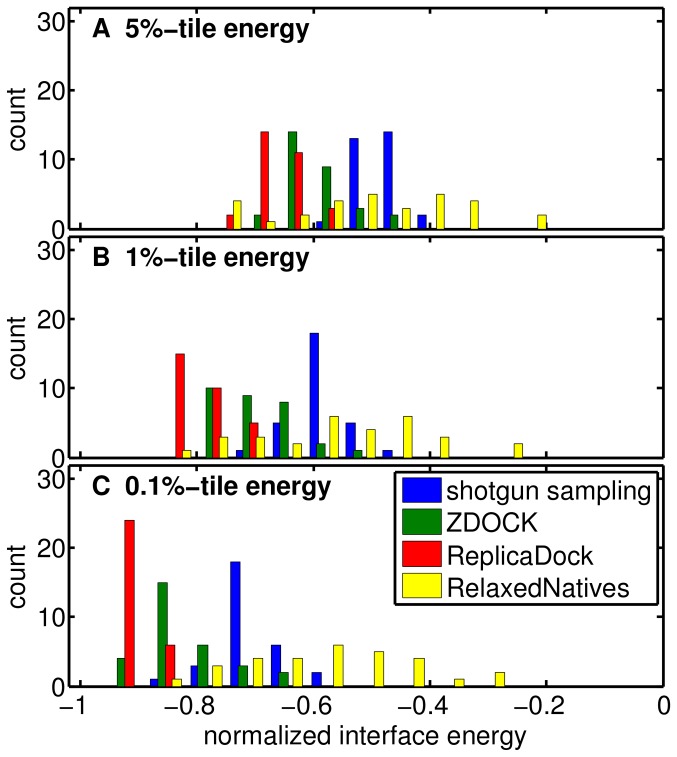
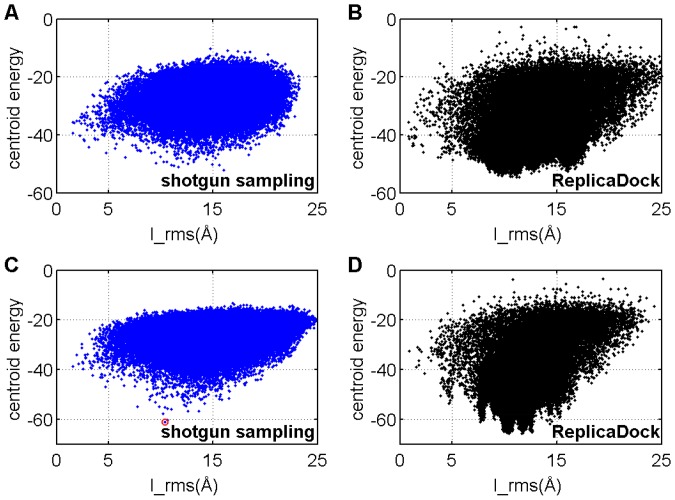
Many protein-protein docking protocols are based on a shotgun approach, in which thousands of independent random-start trajectories minimize the rigid-body degrees of freedom. Another strategy is enumerative sampling as used in ZDOCK. Here, we introduce an alternative strategy, ReplicaDock, using a small number of long trajectories of temperature replica exchange. We compare replica exchange sampling as low-resolution stage of RosettaDock with RosettaDock's original shotgun sampling as well as with ZDOCK. A benchmark of 30 complexes starting from structures of the unbound binding partners shows improved performance for ReplicaDock and ZDOCK when compared to shotgun sampling at equal or less computational expense. ReplicaDock and ZDOCK consistently reach lower energies and generate significantly more near-native conformations than shotgun sampling. Accordingly, they both improve typical metrics of prediction quality of complex structures after refinement. Additionally, the refined ReplicaDock ensembles reach significantly lower interface energies and many previously hidden features of the docking energy landscape become visible when ReplicaDock is applied.
Conflict of interest statement
Figures

Similar articles
-
A combination of rescoring and refinement significantly improves protein docking performance.Proteins. 2008 Jul;72(1):270-9. doi: 10.1002/prot.21920. Proteins. 2008. PMID: 18214977 Free PMC article.
-
CAPRI rounds 3-5 reveal promising successes and future challenges for RosettaDock.Proteins. 2005 Aug 1;60(2):181-6. doi: 10.1002/prot.20555. Proteins. 2005. PMID: 15981262
-
Performance of ZDOCK in CAPRI rounds 20-26.Proteins. 2013 Dec;81(12):2175-82. doi: 10.1002/prot.24432. Proteins. 2013. PMID: 24123140 Free PMC article.
-
Recent Advances in Protein-Protein Docking.Curr Drug Targets. 2016;17(14):1586-1594. doi: 10.2174/1389450117666160112112640. Curr Drug Targets. 2016. PMID: 26758670 Review.
-
Recognition-induced conformational changes in protein-protein docking.Curr Pharm Biotechnol. 2008 Apr;9(2):77-86. doi: 10.2174/138920108783955173. Curr Pharm Biotechnol. 2008. PMID: 18393864 Review.
Cited by
-
Protein-Protein Docking: Past, Present, and Future.Protein J. 2022 Feb;41(1):1-26. doi: 10.1007/s10930-021-10031-8. Epub 2021 Nov 17. Protein J. 2022. PMID: 34787783 Review.
-
BWM*: A Novel, Provable, Ensemble-based Dynamic Programming Algorithm for Sparse Approximations of Computational Protein Design.J Comput Biol. 2016 Jun;23(6):413-24. doi: 10.1089/cmb.2015.0194. Epub 2016 Jan 8. J Comput Biol. 2016. PMID: 26744898 Free PMC article.
-
The RosettaCon 2012 Special Collection: Code Writ on Water, Documentation Writ in Stone.PLoS One. 2013 Sep 26;8(9):e73775. doi: 10.1371/journal.pone.0073775. eCollection 2013. PLoS One. 2013. PMID: 24086295 Free PMC article. No abstract available.
-
Using the multi-objective optimization replica exchange Monte Carlo enhanced sampling method for protein-small molecule docking.BMC Bioinformatics. 2017 Jul 10;18(1):327. doi: 10.1186/s12859-017-1733-6. BMC Bioinformatics. 2017. PMID: 28693470 Free PMC article.
-
Flexible Backbone Assembly and Refinement of Symmetrical Homomeric Complexes.Structure. 2019 Jun 4;27(6):1041-1051.e8. doi: 10.1016/j.str.2019.03.014. Epub 2019 Apr 18. Structure. 2019. PMID: 31006588 Free PMC article.
References
-
- Melquiond ASJ, Karaca E, Kastritis PL, Bonvin AMJJ (2011) Next challenges in protein-protein docking: from proteome to interactome and beyond. WIREs Comput Mol Sci 2: 642–651.
-
- Stein A, Mosca R, Aloy P (2011) Three-dimensional modeling of protein interactions and complexes is going “omics.”. Current Opinion in Structural Biology 21: 200–208. - PubMed
-
- Halperin I, Ma B, Wolfson H, Nussinov R (2002) Principles of docking: An overview of search algorithms and a guide to scoring functions. Proteins: Structure, Function, and Bioinformatics 47: 409–443. - PubMed
Publication types
MeSH terms
Substances
LinkOut - more resources
Full Text Sources
Other Literature Sources
