. 2013 Aug 29;8(8):e72741.
doi: 10.1371/journal.pone.0072741. eCollection 2013.

Simultaneous processing of information on multiple errors in visuomotor learning

Affiliations

Simultaneous processing of information on multiple errors in visuomotor learning

Shoko Kasuga et al. PLoS One. .

Abstract

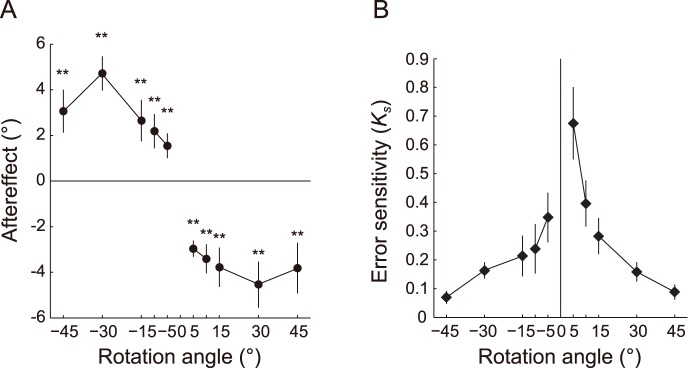
The proper association between planned and executed movements is crucial for motor learning because the discrepancies between them drive such learning. Our study explored how this association was determined when a single action caused the movements of multiple visual objects. Participants reached toward a target by moving a cursor, which represented the right hand's position. Once every five to six normal trials, we interleaved either of two kinds of visual perturbation trials: rotation of the cursor by a certain amount (±15°, ±30°, and ±45°) around the starting position (single-cursor condition) or rotation of two cursors by different angles (+15° and -45°, 0° and 30°, etc.) that were presented simultaneously (double-cursor condition). We evaluated the aftereffects of each condition in the subsequent trial. The error sensitivity (ratio of the aftereffect to the imposed visual rotation) in the single-cursor trials decayed with the amount of rotation, indicating that the motor learning system relied to a greater extent on smaller errors. In the double-cursor trials, we obtained a coefficient that represented the degree to which each of the visual rotations contributed to the aftereffects based on the assumption that the observed aftereffects were a result of the weighted summation of the influences of the imposed visual rotations. The decaying pattern according to the amount of rotation was maintained in the coefficient of each imposed visual rotation in the double-cursor trials, but the value was reduced to approximately 40% of the corresponding error sensitivity in the single-cursor trials. We also found a further reduction of the coefficients when three distinct cursors were presented (e.g., -15°, 15°, and 30°). These results indicated that the motor learning system utilized multiple sources of visual error information simultaneously to correct subsequent movement and that a certain averaging mechanism might be at work in the utilization process.


Conflict of interest statement

Competing Interests: The authors have declared that no competing interests exist.

Figures

Figure 1
Figure 1. Experimental setup and protocols of visual perturbation by multiple cursors.
A: Visual information was displayed on a horizontal white screen board above the hand. Double circles indicate targets, gray circles indicate starting positions, and black circles indicate cursors on the screen. B: In normal trials, a cursor followed the actual movement of the handle (“Normal”), whereas in the single-cursor trials, the cursor was rotated around the starting position (“Single”). In the double-cursor trials of experiments 1 and 2, two cursors were rotated in the same direction (“Same direction”) to different degrees or in the opposite direction (“Opposite direction”) or one cursor was not rotated (“With no rotation”). In the triple-cursor trials (experiment 3), two of three cursors were rotated in the same direction (“Same direction with no rotation”) or the opposite direction (“Opposite direction with no rotation”) or all cursors were rotated in either direction (“All rotation”).
Figure 2
Figure 2. Results of the single-cursor trials in experiments 1 and 2.
Both experiments are shown in the same panel, but the lines are disconnected between 10° and 15° because the data originated from different experiments. The data from −45° to −15° and 15° to 45° were adopted from experiment 1 and those from −10° to 10° were adopted from experiment 2. A: Aftereffects of the single-cursor trials for each rotation. The asterisks indicate significant directional shifts from baseline (**P<0.01). B: The error sensitivity to the imposed rotations (Ks) decayed as the magnitude of rotation increased. The error bars indicate ±1 SE.
Figure 3
Figure 3. Averaged aftereffects of the double-cursor trials in experiments 1 (left) and 2 (right).
The black circles in each panel indicate the aftereffects of the single-cursor trials for comparison. A, B: The aftereffects when two cursors were rotated in the same direction. The red and blue plots indicate the aftereffects of the double-cursor trials. An aftereffect is plotted at the center of two rotational angles (e.g., the aftereffect for the combination of −45° and 30° is plotted at 7.5° on the horizontal axis). C, D: The aftereffects when 1 cursor was not rotated. The open circles indicate the aftereffects of the double-cursor trials. The plot position corresponds to the rotated cursor (e.g., the aftereffect for the combination of 0° and 30° is plotted at 30° on the horizontal axis). E, F: The aftereffects when the cursors were rotated in the opposite directions. The green, red, and blue plots indicate the aftereffects of the double-cursors trials. An aftereffect is plotted at the center of 2 rotational angles. The asterisks indicate significant directional shifts from baseline (*P<0.05; **P<0.01). The statistical significance of the single-cursor trials is not shown. The error bars indicate ±1 SE.
Figure 4
Figure 4. The results of experiments 1 and 2 are indicated in the same panel.
A: The relationship between the aftereffects that were predicted by the linear integration model (eqs. 2 and 3) and the actual aftereffects. B: Comparisons between the error sensitivity (Ks) of the single-cursor trials and the estimated weighting parameter (Kd) of the double-cursor trials for each imposed visual rotation. The filled diamonds indicate Ks, and the open diamonds indicate Kd. Both Ks and Kd decayed as the magnitude of rotation increased, and Kd was about 40% of the corresponding Ks. The lines are disconnected between 10° and 15° because the data originated from different experiments. The error bars indicate ±1 SE. C: Linear regression between Kd and the corresponding Ks. The red plots indicate the parameters of experiment 1, and the blue plots indicate the parameters of experiment 2. The coefficients of regression and the confidence intervals (CI) are also shown. D: The relationship between the aftereffects that were predicted with the parameters that were estimated by leaving 1 cursor combination out at a time and the actual aftereffects.
Figure 5
Figure 5. The relationship between the aftereffects and the mean value of two visual rotations in the double-cursor trials.
The data are plotted for each of the differences in the angles between rotations. For example, the data for 45° (yellow) that is plotted at 22.5° is the aftereffect when the cursors were rotated by 0° and 45°. Note that the data for 0° is the aftereffect that was obtained in the single-cursor condition.
Figure 6
Figure 6. Lack of significant differences in standard deviations (SD) of the aftereffects that were obtained from all participants between the single- and the double-cursor trials.
A black bar indicates the averaged SD of all of the single-cursor trials. The white bars indicate the averaged SD of the double-cursor trials of the same direction (“Same direction”), without rotation (“With no rotation”), and of the opposite direction (“Opposite direction”). The error bars indicate ±1 SE.
Figure 7
Figure 7. Comparisons between the error sensitivity (Ks) in the single-cursor trials and the estimated weighting parameter (Kt) in the triple-cursor trials for each imposed visual rotation.
A: The filled diamonds indicate Ks, and the open diamonds indicate Kt. Both Ks and Kt decayed as the magnitude of rotation increased, and Kt was further decreased from that in experiment 1. The error bars indicate ±1 SE. B: The linear regression between Kt and the corresponding Ks. The coefficients of regression and the confidence intervals (CI) are also shown.
Figure 8
Figure 8. The aftereffects of experiment 3.
The black bars indicate the aftereffects of the single-cursor trials of the labeled rotations, and the white bars indicate the aftereffects of the triple-cursor trials when the labeled rotations were simultaneously imposed. The data for 0° are not shown in the lower row because the average of the standardized baseline movement directions is always 0°. The asterisks indicate significant directional shifts from baseline [*P<0.05; **P<0.01; (*)P<0.05 in one-tailed tests]. The error bars indicate ±1 SE.

References

    1. Bastian AJ (2006) Learning to predict the future: the cerebellum adapts feedforward movement control. Curr Opin Neurobiol 16: 645–649. - PubMed
    1. Imamizu H, Miyauchi S, Tamada T, Sasaki Y, Takino R, et al. (2000) Human cerebellar activity reflecting an acquired internal model of a new tool. Nature 403: 192–195. - PubMed
    1. Kawato M (1999) Internal models for motor control and trajectory planning. Curr Opin Neurobiol 9: 718–727. - PubMed
    1. Wolpert DM, Miall RC, Kawato M (1998) Internal models in the cerebellum. Trends Cogn Sci 2: 338–347. - PubMed
    1. Berniker M, Kording K (2008) Estimating the sources of motor errors for adaptation and generalization. Nat Neurosci 11: 1454–1461. - PMC - PubMed

Publication types

LinkOut - more resources