

Sequential unfolding of beta helical protein by single-molecule atomic force microscopy
- PMID: 24009757
- PMCID: PMC3756990
- DOI: 10.1371/journal.pone.0073572
Sequential unfolding of beta helical protein by single-molecule atomic force microscopy
Abstract
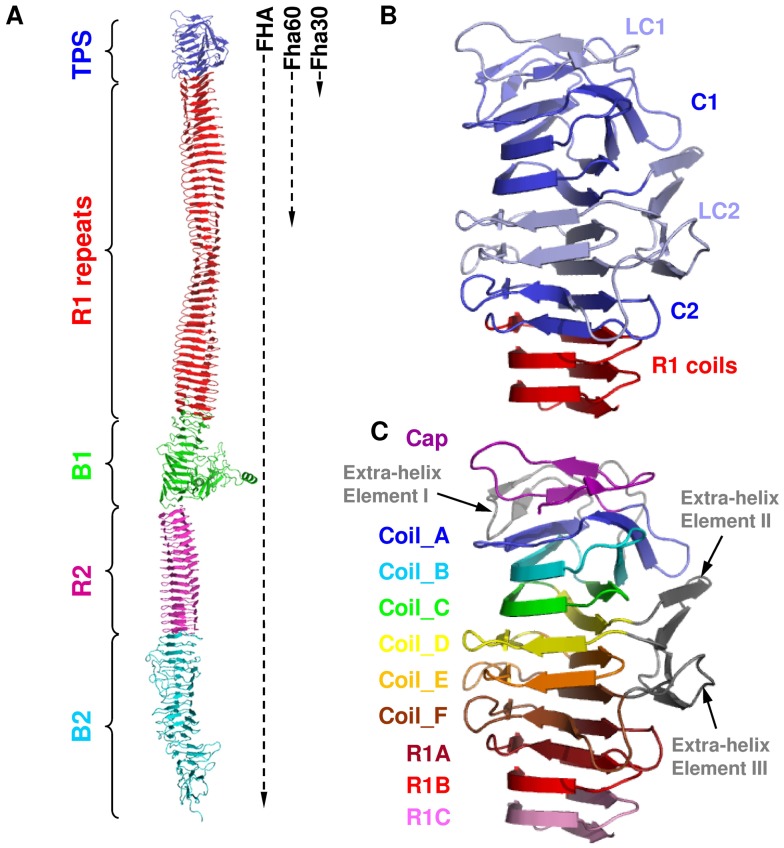
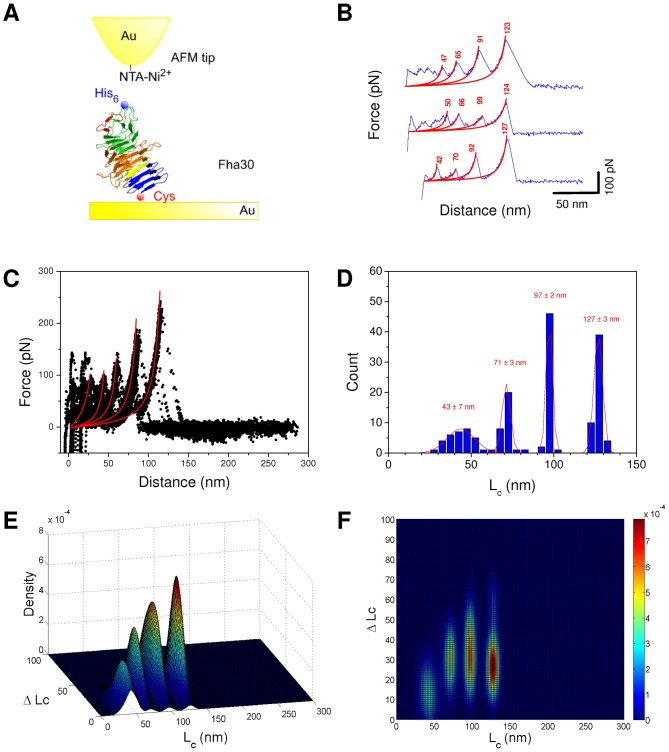
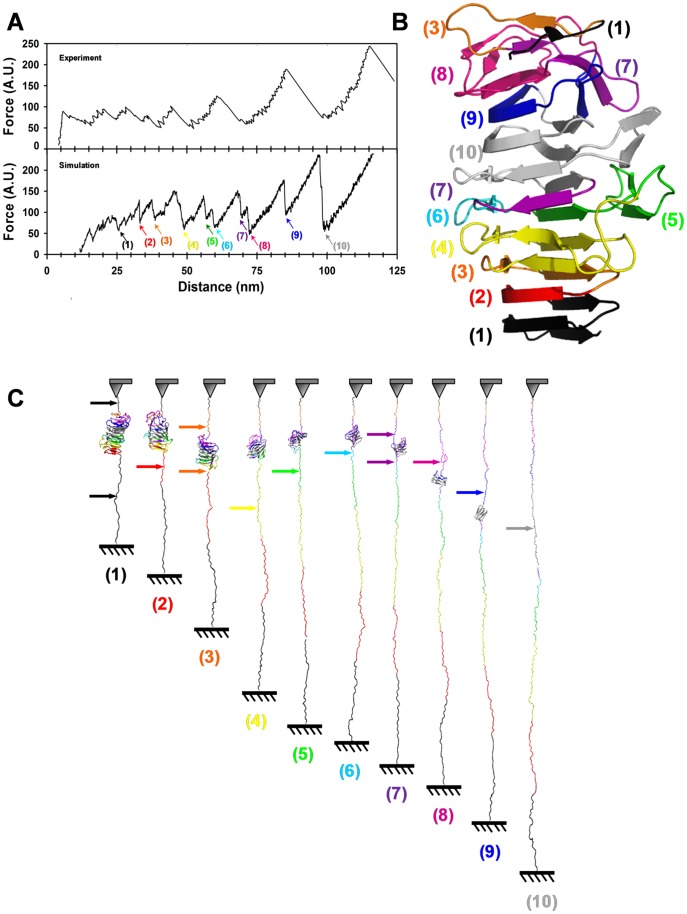
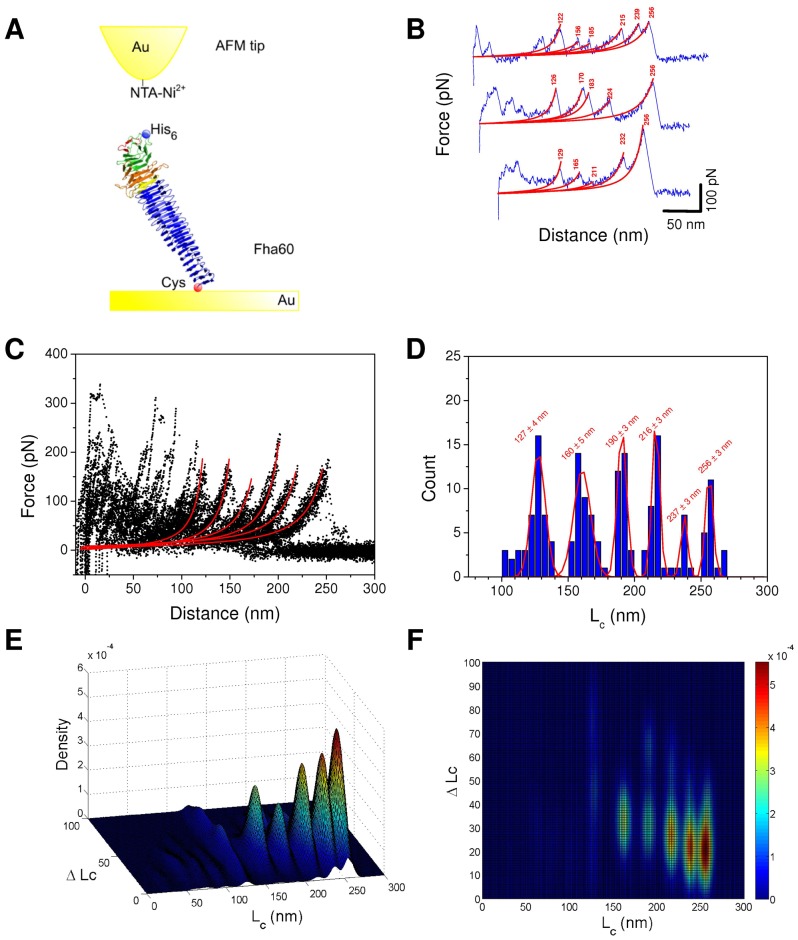
The parallel βhelix is a common fold among extracellular proteins, however its mechanical properties remain unexplored. In Gram-negative bacteria, extracellular proteins of diverse functions of the large 'TpsA' family all fold into long βhelices. Here, single-molecule atomic force microscopy and steered molecular dynamics simulations were combined to investigate the mechanical properties of a prototypic TpsA protein, FHA, the major adhesin of Bordetella pertussis. Strong extension forces were required to fully unfold this highly repetitive protein, and unfolding occurred along a stepwise, hierarchical process. Our analyses showed that the extremities of the βhelix unfold early, while central regions of the helix are more resistant to mechanical unfolding. In particular, a mechanically resistant subdomain conserved among TpsA proteins and critical for secretion was identified. This nucleus harbors structural elements packed against the βhelix that might contribute to stabilizing the N-terminal region of FHA. Hierarchical unfolding of the βhelix in response to a mechanical stress may maintain β-helical portions that can serve as templates for regaining the native structure after stress. The mechanical properties uncovered here might apply to many proteins with β-helical or related folds, both in prokaryotes and in eukaryotes, and play key roles in their structural integrity and functions.
Conflict of interest statement
Figures
Similar articles
-
Mechanically unfolding the small, topologically simple protein L.Biophys J. 2005 Jul;89(1):506-19. doi: 10.1529/biophysj.105.061465. Epub 2005 Apr 29. Biophys J. 2005. PMID: 15863479 Free PMC article.
-
Probing osmolyte participation in the unfolding transition state of a protein.Proc Natl Acad Sci U S A. 2011 Jun 14;108(24):9759-64. doi: 10.1073/pnas.1101934108. Epub 2011 May 25. Proc Natl Acad Sci U S A. 2011. Retraction in: Proc Natl Acad Sci U S A. 2011 Dec 20;108(51):20850. doi: 10.1073/pnas.1118432108. PMID: 21613570 Free PMC article. Retracted.
-
Mechanical unfolding of alpha- and beta-helical protein motifs.Soft Matter. 2019 Feb 6;15(6):1243-1252. doi: 10.1039/c8sm02046a. Soft Matter. 2019. PMID: 30604826
-
Mechanical design of proteins studied by single-molecule force spectroscopy and protein engineering.Prog Biophys Mol Biol. 2000;74(1-2):63-91. doi: 10.1016/s0079-6107(00)00017-1. Prog Biophys Mol Biol. 2000. PMID: 11106807 Review.
-
Probing the mechanical stability of proteins using the atomic force microscope.Biochem Soc Trans. 2007 Dec;35(Pt 6):1564-8. doi: 10.1042/BST0351564. Biochem Soc Trans. 2007. PMID: 18031267 Review.
Cited by
-
Large-Scale Conformational Changes of FhaC Provide Insights Into the Two-Partner Secretion Mechanism.Front Mol Biosci. 2022 Jul 22;9:950871. doi: 10.3389/fmolb.2022.950871. eCollection 2022. Front Mol Biosci. 2022. PMID: 35936790 Free PMC article.
-
Implications for directionality of nanoscale forces in bacterial attachment.Biophys Rep. 2015;1:120-126. doi: 10.1007/s41048-016-0019-2. Epub 2016 Feb 22. Biophys Rep. 2015. PMID: 27340690 Free PMC article.
-
Sequential unfolding of the hemolysin two-partner secretion domain from Proteus mirabilis.Protein Sci. 2015 Nov;24(11):1841-55. doi: 10.1002/pro.2791. Epub 2015 Sep 9. Protein Sci. 2015. PMID: 26350294 Free PMC article.
-
Looks can be deceiving: recent insights into the mechanism of protein secretion by the autotransporter pathway.Mol Microbiol. 2015 Jul;97(2):205-15. doi: 10.1111/mmi.13031. Epub 2015 May 15. Mol Microbiol. 2015. PMID: 25881492 Free PMC article. Review.
-
Structural and biophysical characterization of the secreted, β-helical adhesin EtpA of Enterotoxigenic Escherichia coli.PLoS One. 2023 Jun 21;18(6):e0287100. doi: 10.1371/journal.pone.0287100. eCollection 2023. PLoS One. 2023. PMID: 37343026 Free PMC article.
References
-
- Kajava AV, Steven AC (2006) β-rolls, β-helices, and other β-solenoid proteins. Adv Protein Chem 73: 55–96. - PubMed
-
- Jenkins J, Pickersgill R (2001) The architecture of parallel β-helices and related folds. Prog Biophys Mol Biol 77: 111–175. - PubMed
-
- Yoder MD, Keen NT, Jurnak F (1993) New domain motif: the structure of pectate lyase C, a secreted plant virulence factor. Science 260: 1503–1507. - PubMed
Publication types
MeSH terms
Substances
LinkOut - more resources
Full Text Sources
Other Literature Sources
