Fast characterisation of cell-derived extracellular vesicles by nanoparticles tracking analysis, cryo-electron microscopy, and Raman tweezers microspectroscopy
- PMID: 24009887
- PMCID: PMC3760651
- DOI: 10.3402/jev.v1i0.19179
Fast characterisation of cell-derived extracellular vesicles by nanoparticles tracking analysis, cryo-electron microscopy, and Raman tweezers microspectroscopy
Abstract
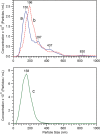
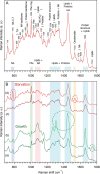
The joint use of 3 complementary techniques, namely, nanoparticle tracking analysis (NTA), cryo-electron microscopy (Cryo-EM) and Raman tweezers microspectroscopy (RTM), is proposed for a rapid characterisation of extracellular vesicles (EVs) of various origins. NTA is valuable for studying the size distribution and concentration, Cryo-EM is outstanding for the morphological characterisation, including observation of vesicle heterogeneity, while RTM provides the global chemical composition without using any exogenous label. The capabilities of this approach are evaluated on the example of cell-derived vesicles of Dictyostelium discoideum, a convenient general model for eukaryotic EVs. At least 2 separate species differing in chemical composition (relative amounts of DNA, lipids and proteins, presence of carotenoids) were found for each of the 2 physiological states of this non-pathogenic microorganism, that is, cell growth and starvation-induced aggregation. These findings demonstrate the specific potency of RTM. In addition, the first Raman spectra of human urinary exosomes are reported, presumably constituting the primary step towards Raman characterisation of EVs for the purpose of human diseases diagnoses.
Keywords: Dictyostelium discoideum; Raman tweezers microspectroscopy; cryo-electron microscopy; extracellular vesicles; nanoparticle tracking analysis; urinary exosomes.
Figures


Similar articles
-
Raman tweezers microspectroscopy of circa 100 nm extracellular vesicles.Nanoscale. 2019 Jan 23;11(4):1661-1679. doi: 10.1039/c8nr04677h. Nanoscale. 2019. PMID: 30620023
-
The Methods of Choice for Extracellular Vesicles (EVs) Characterization.Int J Mol Sci. 2017 May 29;18(6):1153. doi: 10.3390/ijms18061153. Int J Mol Sci. 2017. PMID: 28555055 Free PMC article. Review.
-
A direct-imaging cryo-EM study of shedding extracellular vesicles from leukemic monocytes.J Struct Biol. 2017 Jun;198(3):177-185. doi: 10.1016/j.jsb.2017.02.004. Epub 2017 Feb 22. J Struct Biol. 2017. PMID: 28254382
-
Assets of the non-pathogenic microorganism Dictyostelium discoideum as a model for the study of eukaryotic extracellular vesicles.F1000Res. 2013 Mar 4;2:73. doi: 10.12688/f1000research.2-73.v1. F1000Res. 2013. PMID: 24358862 Review.
-
Assets of the non-pathogenic microorganism Dictyostelium discoideum as a model for the study of eukaryotic extracellular vesicles.F1000Res. 2013 Mar 4;2:73. doi: 10.12688/f1000research.2-73.v1. eCollection 2013. F1000Res. 2013. PMID: 24327885 Free PMC article. Review.
Cited by
-
Cryo-electron microscopy of adipose tissue extracellular vesicles in obesity and type 2 diabetes mellitus.PLoS One. 2023 Feb 24;18(2):e0279652. doi: 10.1371/journal.pone.0279652. eCollection 2023. PLoS One. 2023. PMID: 36827314 Free PMC article.
-
Recent advances in optical label-free characterization of extracellular vesicles.Nanophotonics. 2022 Apr 13;11(12):2827-2863. doi: 10.1515/nanoph-2022-0057. eCollection 2022 Jun 1. Nanophotonics. 2022. PMID: 35880114 Free PMC article. Review.
-
Diversity of extracellular vesicles in human ejaculates revealed by cryo-electron microscopy.J Extracell Vesicles. 2015 Nov 11;4:28680. doi: 10.3402/jev.v4.28680. eCollection 2015. J Extracell Vesicles. 2015. PMID: 26563734 Free PMC article.
-
Engineered Extracellular Vesicles as a New Class of Nanomedicine.Chem Bio Eng. 2024 Oct 28;2(1):3-22. doi: 10.1021/cbe.4c00122. eCollection 2025 Jan 23. Chem Bio Eng. 2024. PMID: 39975802 Free PMC article. Review.
-
Cancer diagnosis using label-free SERS-based exosome analysis.Theranostics. 2024 Feb 24;14(5):1966-1981. doi: 10.7150/thno.92621. eCollection 2024. Theranostics. 2024. PMID: 38505618 Free PMC article. Review.
References
-
- ISEV. Abstracts from the First International Meeting of the International Society for Extracellular Vesicles 2012, Gothenburg, Sweden. J Extracell Vesicles. 2012;(Suppl 1) 18182, doi: http://dx.doi.org/10.3402/jev.v1i0.18182. - DOI
-
- van der Pol E, Hoekstra AG, Sturk A, Otto C, van Leeuwen TG, Nieuwland R. Optical and non-optical methods for detection and characterization of microparticles and exosomes. J Thromb Haemost. 2010;8:2596–607. - PubMed
-
- van der Pol E, van Gemert MJ, Sturk A, Nieuwland R, van Leeuwen TG. Single vs. swarm detection of microparticles and exosomes by flow cytometry. J Thromb Haemost. 2012;10:919–30. - PubMed
-
- Chandler WL, Yeung W, Tait JF. A new microparticle size calibration standard for use in measuring smaller microparticles using a new flow cytometer. J Thromb Haemost. 2011;9:1216–24. - PubMed
LinkOut - more resources
Full Text Sources
Other Literature Sources

