. 2013 Aug 30:3:225.
doi: 10.3389/fonc.2013.00225. eCollection 2013.

Variable Expression of GLIPR1 Correlates with Invasive Potential in Melanoma Cells

Affiliations

Variable Expression of GLIPR1 Correlates with Invasive Potential in Melanoma Cells

Anshul Awasthi et al. Front Oncol. .

Abstract

GLI pathogenesis-related 1 (GLIPR1) was previously identified as an epigenetically regulated tumor suppressor in prostate cancer and, conversely, an oncoprotein in glioma. More recently, GLIPR1 was shown to be differentially expressed in other cancers including ovarian, acute myeloid leukemia, and Wilms' tumor. Here we investigated GLIPR1 expression in metastatic melanoma cell lines and tissue. GLIPR1 was variably expressed in metastatic melanoma cells, and transcript levels correlated with degree of GLIPR1 promoter methylation in vitro. Elevated GLIPR1 levels were correlated with increased invasive potential, and siRNA-mediated knockdown of GLIPR1 expression resulted in reduced cell migration and proliferation in vitro. Immunohistochemical studies of melanoma tissue microarrays showed moderate to high staining for GLIPR1 in 50% of specimens analyzed. GLIPR1 staining was observed in normal skin in merocrine sweat glands, sebaceous glands, and hair follicles within the dermis.

Keywords: CAP; GLIPR1; invasion; melanoma; methylation.


Figures
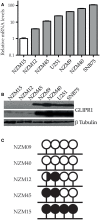
Figure 1
Figure 1
GLIPR1 expression and promoter methylation in melanoma cells. (A) Relative mRNA transcript levels of GLIPR1 in different melanoma and glioma cells were quantified by RT-qPCR, normalized to reference genes YWHAZ and UBC, and reported relative to levels in NZM15. Results are mean of three independent experiments and error bars indicate SEM. (B) GLIPR1 protein levels in different melanoma and glioma cell lines were determined by western blotting with each lane loaded with 100 μg of total protein; the top GLIPR1 blot and β-tubulin loading control (bottom) was exposed for 5 min, and the center GLIPR1 blot exposed overnight. Two separate experiments gave similar results. (C) Summary of bisulfite sequencing data showing GLIPR1 CpG promoter methylation status for melanoma cell lines with known invasive potential (this study). NZM09 and NZM40 are strongly invasive compared to the remaining cell lines. Lollipops represent individual CpG dinucleotides within a CpG island in the GLIPR1 promoter. DNA from three different vials of each NZM cell line was sequenced at least twice on both strands. White, unmethylated; black, methylated; black/white, hemimethylated.
Figure 2
Figure 2
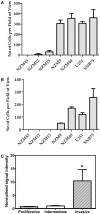
GLIPR1 cell migration and invasion. Frequency with which melanoma and glioma cells cross a pored membrane by (A) migration or (B) invasion was assessed by microscope after 24 h. Number of migrating or invading cells was calculated by counting the number of cells per field of view in 25 microscopic fields per well. Data shown as the average number of cells per field of view ± SEM from three (A) or two (B) independent experiments respectively. (C) GLIPR1 transcript levels were significantly higher in an independent panel of cell lines with experimentally validated invasive potential (20).
Figure 3
Figure 3
GLIPR1 siRNA knockdown decreases cellular invasion and proliferation. (A) GLIPR1 protein levels following knockdown were determined by western blotting (40 μg of total protein per lane) from cells 72 h following transfection with siRNA. GLIPR1 knockdown with siGLI (+) and control treatment with non-targeting siRNA siNT (−) are indicated above gel. Low levels of endogenous GLIPR1 prevented assessment of the extent of knockdown in NZM15, NZM12, and NZM45 by western blotting. Relative migration (B) and invasion (C) of cells across the membrane of transwell inserts was measured 24 h after siGLI. Data shown as the average number of cells per field of view ± SEM from three (B) or two (C) independent experiments. Error bars indicate SEM; *p < 0.005, **p < 0.001. No migration was observed for NZM45 (Figure 2A) and no invasion was seen for NZM45, NZM12, or NZM15 (Figure 2B). (D) Cell proliferation was quantified using MTT-based colorimetric assay. Results are mean of two independent experiments, n = 4. Results in (D) are shown as data for cells 4 days after transfection with siGLI relative to data for cells transfected with siNT. Results for (B,C) are shown for cells 24 h following transfection.
Figure 4
Figure 4
GLIPR1 staining in malignant melanoma. GLIPR1 immuno-staining in (A) malignant melanoma of the heel (+, low staining intensity), (B) malignant melanoma of the pate/crown (++, moderate staining intensity), and (C) malignant melanoma of the thumb (+++, high staining intensity). GLIPR1 immuno-positive regions were stained with NovaRED. All images were photographed at a power of 200×. Scale bar = 50 μm. Samples shown are from Melanoma tissue microarrays (US Biomax, Inc.).
Figure 5
Figure 5
Immunohistochemical staining of GLIPR1 in skin specimens. Immuno-reactive cells of normal skin (A), sweat glands (B), sebaceous glands, (C), hair follicles (D). Skin specimens (A–C) were stained with NovaRED to give a red color for GLIPR1 immuno-positive regions, while hair follicles (D) were stained with DAB to give brown color for GLIPR1. Cell nuclei are stained blue with hematoxylin. Inset images show negative control reacted with the non-specific goat serum instead of anti-GLIPR1 antibody. Lack of brown staining in the negative control indicates this is due to GLIPR1 and not melanin. All images were photographed at a power of 400×.

References

    1. Ren C, Li L, Goltsov AA, Timme TL, Tahir SA, Wang J, et al. mRTVP-1, a novel p53 target gene with proapoptotic activities. Mol Cell Biol (2002) 22:3345–5710.1128/MCB.22.10.3345-3357.2002 - DOI - PMC - PubMed
    1. Ren C, Li L, Yang G, Timme TL, Goltsov A, Ji X, et al. RTVP-1, a tumor suppressor inactivated by methylation in prostate cancer. Cancer Res (2004) 64:969–7610.1158/0008-5472.CAN-03-2592 - DOI - PubMed
    1. Ren C, Ren CH, Li L, Goltsov AA, Thompson TC. Identification and characterization of RTVP1/GLIPR1-like genes, a novel p53 target gene cluster. Genomics (2006) 88:163–7210.1016/j.ygeno.2006.03.021 - DOI - PubMed
    1. Murphy EV, Zhang Y, Zhu W, Biggs J. The human glioma pathogenesis-related protein is structurally related to plant pathogenesis-related proteins and its gene is expressed specifically in brain tumors. Gene (1995) 159:131–510.1016/0378-1119(95)00061-A - DOI - PubMed
    1. Rich T, Chen P, Furman F, Huynh N, Israel MA. RTVP-1, a novel human gene with sequence similarity to genes of diverse species, is expressed in tumor cell lines of glial but not neuronal origin. Gene (1996) 180:125–3010.1016/S0378-1119(96)00431-3 - DOI - PubMed

LinkOut - more resources