. 2013 Sep 3;105(5):1110-22.
doi: 10.1016/j.bpj.2013.06.051.

Novel automated tracking analysis of particles subjected to shear flow: kindlin-3 role in B cells

Affiliations

Novel automated tracking analysis of particles subjected to shear flow: kindlin-3 role in B cells

Frances Willenbrock et al. Biophys J. .

Abstract

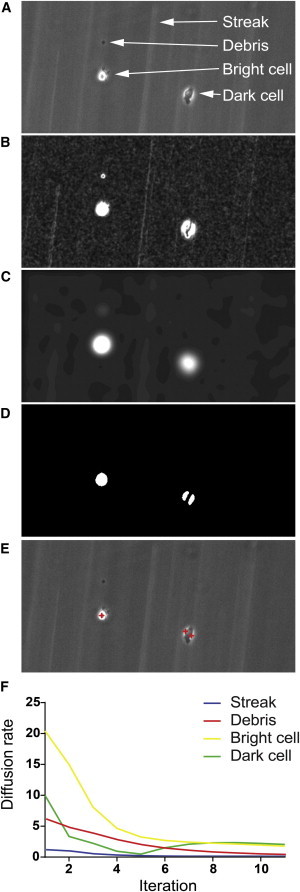
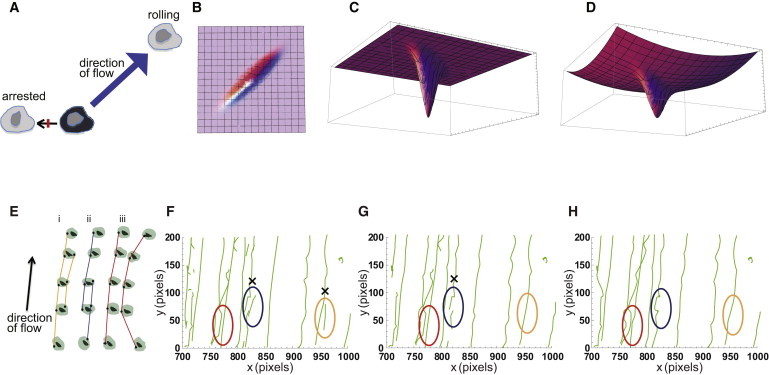
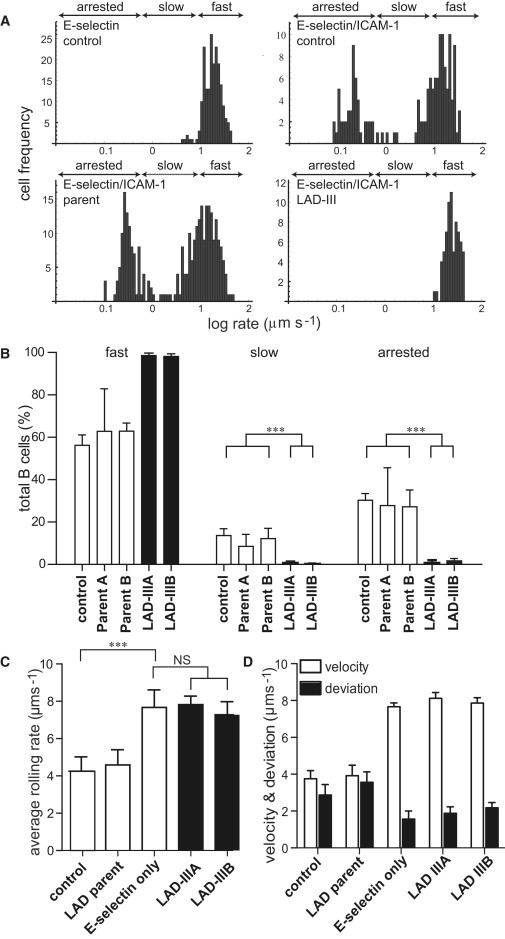
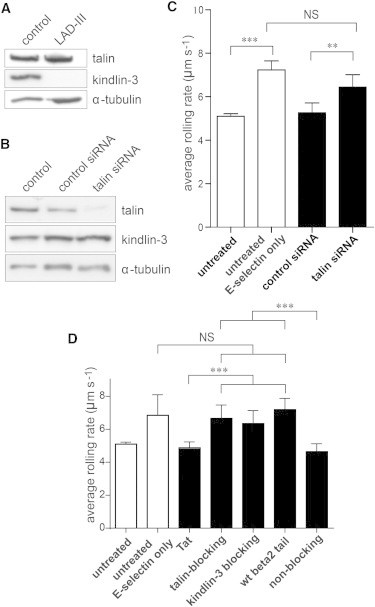
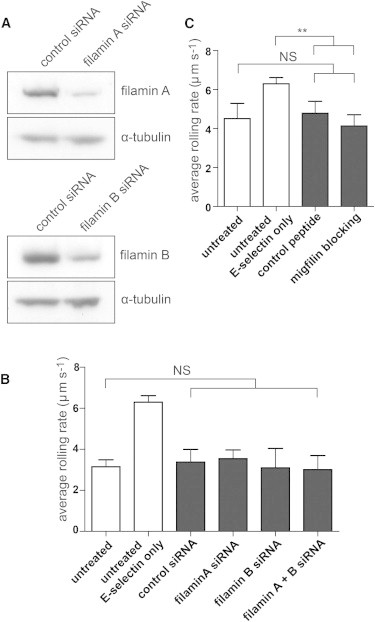
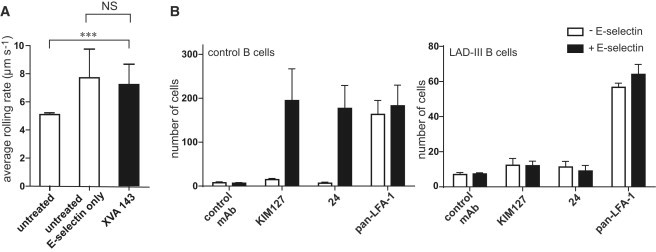
Shear flow assays are used to mimic the influence of physiological shear force in diverse situations such as leukocyte rolling and arrest on the vasculature, capture of nanoparticles, and bacterial adhesion. Analysis of such assays usually involves manual counting, is labor-intensive, and is subject to bias. We have developed the Leukotrack program that incorporates a novel (to our knowledge) segmentation routine capable of reliable detection of cells in phase contrast images. The program also automatically tracks rolling cells in addition to those that are more firmly attached and migrating in random directions. We demonstrate its use in the analysis of lymphocyte arrest mediated by one or more active conformations of the integrin LFA-1. Activation of LFA-1 is a multistep process that depends on several proteins including kindlin-3, the protein that is mutated in leukocyte adhesion deficiency-III patients. We find that the very first stage of LFA-1-mediated attaching is unable to proceed in the absence of kindlin-3. Our evidence indicates that kindlin-3-mediated high-affinity LFA-1 controls both the early transient integrin-dependent adhesions in addition to the final stable adhesions made under flow conditions.


Figures

Figure 1
Figure 1
Illustration of the image segmentation process. (A) Phase contrast image with highlighted streak, debris, bright cells, and a dark cell. (B) Image after application of high-pass filter and the first convolution iteration. Streaks, debris, and cells are enhanced. (C) Image after the ninth convolution iteration. Debris and streaks express lower intensities, whereas cells are still clearly visible. (D) Segmented image of cumulative diffusion rate after a threshold has been applied (Eq. 1). The dark cell is represented by two different fragments. This was allowed to happen as moving fragments would later be resolved in the tracking process. (E) Centers of identified cells and fragments of cells are marked with red crosses and overlaid with the original phase contrast image. The coordinates of the tracks feed into the tracking process. (F) Plot of diffusion rates for the debris, the streak, the bright cell, and the dark cell. The diffusion rate is expressed as a function of iterations. Streaks express a low decreasing diffusion rate. Debris expresses initially a higher diffusion rate that decreases and approaches that of streaks after 10 iterations. Bright cells express a high diffusion rate that decreases over time but remains above that of debris and streaks after 10 iterations. Dark cells with low contrast only initially express a higher diffusion rate that quickly decreases and then increases again. The weighted cumulative sum of the diffusion rates provides a robust means to distinguish between cells with low and high contrast from debris and streaks.
Figure 2
Figure 2
Elliptical distribution of EBV-transformed B cells rolling under shear flow. (A) Schematic demonstrating failure of tracking using nearest neighbor principle. The light cells represent possible positions of the dark cell in the subsequent frame. A rolling cell travels farther than an arrested cell but would be incorrectly tracked to the position of the labeled arrested cell. (B) and (C) Graphical representation of the 2D Gaussian described by Eq. 2 depicted from directly above (B) and below and at an angle (C). (D) Graphical representation of the 2D Gaussian described by Eq. 4 showing the impact of combining elliptical and circular Gaussian distributions. (E–H) Examples of parallel tracks that can arise from multiple cell assignments and their corrections. (E) Graphic depiction of parallel tracks that can arise from multiple cell assignments that are corrected in a small part of a movie in which the individual cell tracks (green) move in the direction of flow. (F–H) Examples are orange (i) and blue (ii) ovals, overlapping tracks that are incorrectly assigned, then corrected; red oval (iii), two cells moving in parallel where the tracks are correctly assigned.
Figure 3
Figure 3
Use of the Leukotrack program to show the behavior of LAD-III, parent, and control B lymphoblasts in a shear flow assay. (A) Representative data showing adhesive activity of a control EBV-transformed B cell line on E-selectin alone or E-selectin/ICAM-1 compared with parent and LAD-III patient B cells on E-selectin/ICAM-1; n = 100–300 cells per condition. (B) Histogram showing rates of rolling on E-selectin/ICAM-1: control B cell line, two matching parent and LAD-III patient B cell lines. Data sets were analyzed using one-way analysis of variance for each behavior (n = 14 movies for control and parent, data are shown as mean ± SEM; n = 8 movies for patient A, n = 8 movies for patient B, ∗∗∗p < 0.0001). (C) Summary of data in (B) depicted as the average rate of rolling of the total cell population for each group of cells. The E-selectin data were obtained using control B cells flowing over E-selectin only. (D) The standard deviations of the mean are plotted alongside the mean rolling velocity for control, parent, and patient cells rolling on E-selectin and ICAM-1 and for control cells rolling on E-selectin only. Data represent mean ± SEM for 200 cells in four separate assays.
Figure 4
Figure 4
The effect on rolling rates of blocking talin and kindlin-3 function in B cells. (A) Western blot of control and LAD-III patient B cells showing expression levels of talin and kindlin-3; α-tubulin represents the sample loading control. (B) Western blot showing expression level of talin reduced to (25.5 ± 4.8%, n = 7) and kindlin-3 in control B cells transfected with either control siRNA or talin siRNA; α-tubulin represents the sample loading control. (C) Rates of rolling of either untransfected B cells rolling on E-selectin/ICAM-1 and E-selectin alone (untreated, white bars) compared with B cells transfected with either control or talin siRNAs on E-selectin/ICAM-1 (transfected, black bars); n = 6 independent experiments. Data are shown as mean ± SEM; ∗∗∗p < 0.001; ∗∗,p < 0.01. (D) Rates of rolling of either untreated B cells on E-selectin/ICAM-1 or E-selectin alone (untreated, white bars) compared with B cells on E-selectin/ICAM-1 treated with Tat peptide (Tat) or LFA-1 β2 cytoplasmic tail peptides: wild-type sequence (wt β2 tail), talin-binding site modified (kindlin-3 blocking), kindlin-3-binding site modified (talin blocking), both talin and kindlin-3 sites modified (nonblocking) (black bars); from n = 5 independent experiments. Data are shown as mean ± SEM; ∗∗∗p < 0.001.
Figure 5
Figure 5
The effect of blocking filamin and migfilin function on rolling rates of B cells on E-selectin/ICAM-1. (A) Western blot showing expression level of filamins A (reduced to 17.6% ± 3.6, n = 3) and B (reduced to 25.3 ± 2.5%) in control B cells treated with either control siRNA or filamin siRNA; α-tubulin represent the sample loading control; n = 2. (B) Rates of rolling of untreated B cells rolling on E-selectin/ICAM-1 (control) or E-selectin alone (E-selectin) (white bars) compared with B cells on E-selectin/ICAM-1 treated with either control siRNA or filamins A and B siRNAs either individually or together (black bars) from n = 3 independent experiments. Data are shown as mean ± SEM; NS = not significant. (C) Rates of rolling of untreated B cells rolling on E-selectin/ICAM-1 or E-selectin alone (untreated, white bars) compared with B cells on E-selectin/ICAM-1 treated with control migfilin peptide with modified filamin binding site (control) or with an intact filamin-binding site (migfilin blocking) (black bars) from n = 3 independent experiments. Data are shown as mean ± SEM; NS = not significant.
Figure 6
Figure 6
The activation state of LFA-1 after B cell stimulation through E-selectin binding. (A) Rates of rolling of untreated B cells on E-selectin/ICAM-1 (control) or E-selectin alone (E-selectin) (white bars) compared with B cells on E-selectin/ICAM-1 treated with the inhibitor XVA143 (black bar). (B) Numbers of control and LAD-III B cells attached by pan-LFA-1 mAb, β2 extension mAb KIM127, activation mAb 24, or isotype control mAbs following exposure (black bars) or not (white bars) to E-selectin; n = 3 independent experiments. Data are shown as mean ± SEM.

Comment in

Similar articles

Cited by

References

    1. Nourshargh S., Hordijk P.L., Sixt M. Breaching multiple barriers: leukocyte motility through venular walls and the interstitium. Nat. Rev. Mol. Cell Biol. 2010;11:366–378. - PubMed
    1. Chaffer C.L., Weinberg R.A. A perspective on cancer cell metastasis. Science. 2011;331:1559–1564. - PubMed
    1. Mazo I.B., Massberg S., von Andrian U.H. Hematopoietic stem and progenitor cell trafficking. Trends Immunol. 2011;32:493–503. - PMC - PubMed
    1. Thomas W., Forero M., Vogel V. Catch-bond model derived from allostery explains force-activated bacterial adhesion. Biophys. J. 2006;90:753–764. - PMC - PubMed
    1. Kim M.J., Rhee K. Computational analysis of nanoparticle adhesion to endothelium: effects of kinetic rate constants and wall shear rates. Med. Biol. Eng. Comput. 2011;49:733–741. - PubMed

Publication types

LinkOut - more resources