

Sarcoplasmic reticulum K(+) (TRIC) channel does not carry essential countercurrent during Ca(2+) release
- PMID: 24010658
- PMCID: PMC3762336
- DOI: 10.1016/j.bpj.2013.07.042
Sarcoplasmic reticulum K(+) (TRIC) channel does not carry essential countercurrent during Ca(2+) release
Abstract
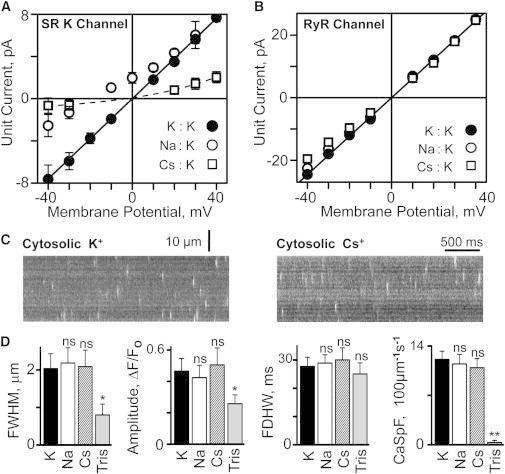
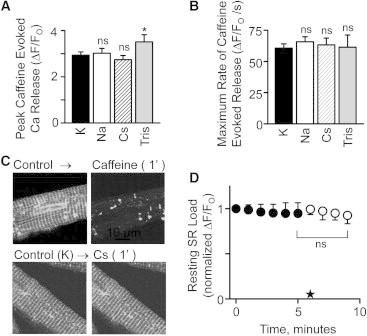
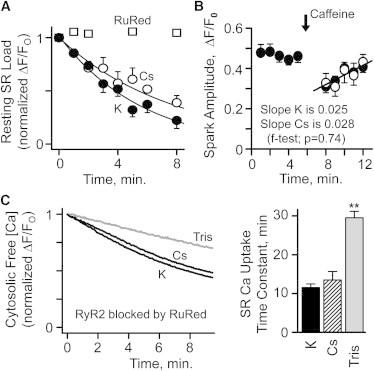
The charge translocation associated with sarcoplasmic reticulum (SR) Ca(2+) efflux is compensated for by a simultaneous SR K(+) influx. This influx is essential because, with no countercurrent, the SR membrane potential (Vm) would quickly (<1 ms) reach the Ca(2+) equilibrium potential and SR Ca(2+) release would cease. The SR K(+) trimeric intracellular cation (TRIC) channel has been proposed to carry the essential countercurrent. However, the ryanodine receptor (RyR) itself also carries a substantial K(+) countercurrent during release. To better define the physiological role of the SR K(+) channel, we compared SR Ca(2+) transport in saponin-permeabilized cardiomyocytes before and after limiting SR K(+) channel function. Specifically, we reduced SR K(+) channel conduction 35 and 88% by replacing cytosolic K(+) for Na(+) or Cs(+) (respectively), changes that have little effect on RyR function. Calcium sparks, SR Ca(2+) reloading, and caffeine-evoked Ca(2+) release amplitude (and rate) were unaffected by these ionic changes. Our results show that countercurrent carried by SR K(+) (TRIC) channels is not required to support SR Ca(2+) release (or uptake). Because K(+) enters the SR through RyRs during release, the SR K(+) (TRIC) channel most likely is needed to restore trans-SR K(+) balance after RyRs close, assuring SR Vm stays near 0 mV.
Copyright © 2013 Biophysical Society. Published by Elsevier Inc. All rights reserved.
Figures

Similar articles
-
Trimeric intracellular cation channels and sarcoplasmic/endoplasmic reticulum calcium homeostasis.Circ Res. 2014 Feb 14;114(4):706-16. doi: 10.1161/CIRCRESAHA.114.301816. Circ Res. 2014. PMID: 24526676 Free PMC article. Review.
-
Sarcoplasmic Reticulum Ca2+ Release Uses a Cascading Network of Intra-SR and Channel Countercurrents.Biophys J. 2018 Jan 23;114(2):462-473. doi: 10.1016/j.bpj.2017.11.3775. Biophys J. 2018. PMID: 29401443 Free PMC article.
-
Dampened activity of ryanodine receptor channels in mutant skeletal muscle lacking TRIC-A.J Physiol. 2017 Jul 15;595(14):4769-4784. doi: 10.1113/JP273550. Epub 2017 May 23. J Physiol. 2017. PMID: 28387457 Free PMC article.
-
Ca2+ overload and sarcoplasmic reticulum instability in tric-a null skeletal muscle.J Biol Chem. 2010 Nov 26;285(48):37370-6. doi: 10.1074/jbc.M110.170084. Epub 2010 Sep 21. J Biol Chem. 2010. PMID: 20858894 Free PMC article.
-
New and notable ion-channels in the sarcoplasmic/endoplasmic reticulum: do they support the process of intracellular Ca²⁺ release?J Physiol. 2015 Aug 1;593(15):3241-51. doi: 10.1113/jphysiol.2014.281881. Epub 2014 Nov 17. J Physiol. 2015. PMID: 26228553 Free PMC article. Review.
Cited by
-
Ion Channels of the Islets in Type 2 Diabetes.J Mol Biol. 2020 Mar 6;432(5):1326-1346. doi: 10.1016/j.jmb.2019.08.014. Epub 2019 Aug 30. J Mol Biol. 2020. PMID: 31473158 Free PMC article. Review.
-
Selecting ions by size in a calcium channel: the ryanodine receptor case study.Biophys J. 2014 Nov 18;107(10):2263-73. doi: 10.1016/j.bpj.2014.09.031. Biophys J. 2014. PMID: 25418295 Free PMC article.
-
Ion- and water-binding sites inside an occluded hourglass pore of a trimeric intracellular cation (TRIC) channel.BMC Biol. 2017 Apr 22;15(1):31. doi: 10.1186/s12915-017-0372-8. BMC Biol. 2017. PMID: 28431535 Free PMC article.
-
TALK-1 channels control β cell endoplasmic reticulum Ca2+ homeostasis.Sci Signal. 2017 Sep 19;10(497):eaan2883. doi: 10.1126/scisignal.aan2883. Sci Signal. 2017. PMID: 28928238 Free PMC article.
-
Flecainide induces a sustained countercurrent dependent effect on RyR2 in permeabilized WT ventricular myocytes but not in intact cells.Front Pharmacol. 2023 Apr 12;14:1155601. doi: 10.3389/fphar.2023.1155601. eCollection 2023. Front Pharmacol. 2023. PMID: 37124209 Free PMC article.
References
-
- Cheng H., Lederer W.J., Cannell M.B. Calcium sparks: elementary events underlying excitation-contraction coupling in heart muscle. Science. 1993;262:740–744. - PubMed
-
- Somlyo A.V., McClellan G., Somlyo A.P. Electron probe x-ray microanalysis of post-tetanic Ca2+ and Mg2+ movements across the sarcoplasmic reticulum in situ. J. Biol. Chem. 1985;260:6801–6807. - PubMed
Publication types
MeSH terms
Substances
Grants and funding
LinkOut - more resources
Full Text Sources
Other Literature Sources
Research Materials
Miscellaneous
