

Nanopore force spectroscopy of aptamer-ligand complexes
- PMID: 24010663
- PMCID: PMC3762367
- DOI: 10.1016/j.bpj.2013.07.047
Nanopore force spectroscopy of aptamer-ligand complexes
Abstract
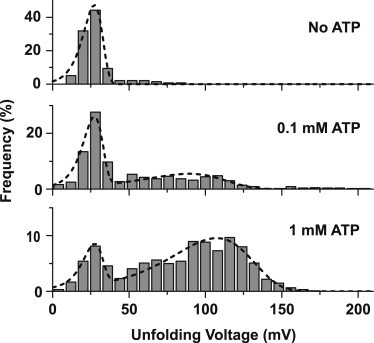
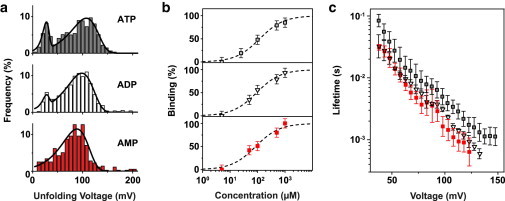
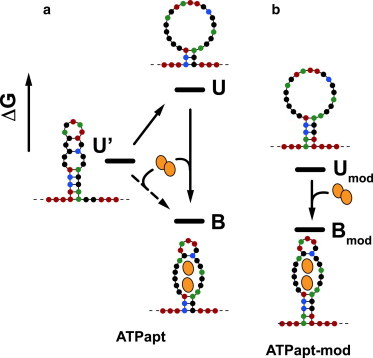
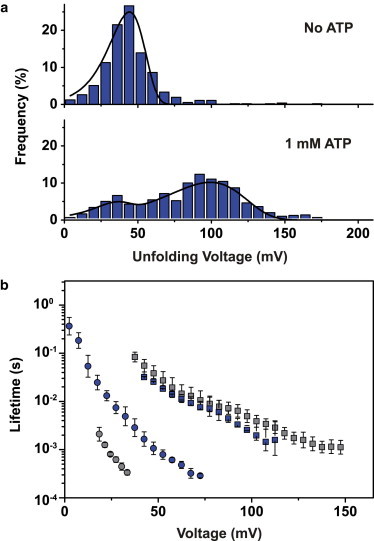
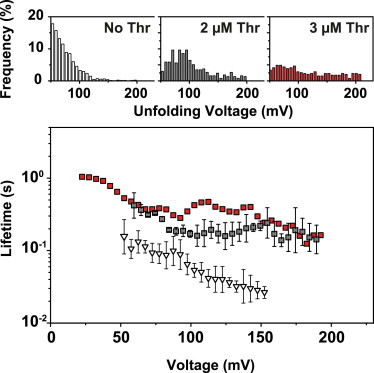
The stability of aptamer-ligand complexes is probed in nanopore-based dynamic force spectroscopy experiments. Specifically, the ATP-binding aptamer is investigated using a backward translocation technique, in which the molecules are initially pulled through an α-hemolysin nanopore from the cis to the trans side of a lipid bilayer membrane, allowed to refold and interact with their target, and then translocated back in the trans-cis direction. From these experiments, the distribution of bound and unbound complexes is determined, which in turn allows determination of the dissociation constant Kd ≈ 0.1 mM of the aptamer and of voltage-dependent unfolding rates. The experiments also reveal differences in binding of the aptamer to AMP, ADP, or ATP ligands. Investigation of an aptamer variant with a stabilized ATP-binding site indicates fast conformational switching of the original aptamer before ATP binding. Nanopore force spectroscopy is also used to study binding of the thrombin-binding aptamer to its target. To detect aptamer-target interactions in this case, the stability of the ligand-free aptamer-containing G-quadruplexes-is tuned via the potassium content of the buffer. Although the presence of thrombin was detected, limitations of the method for aptamers with strong secondary structures and complexes with nanomolar Kd were identified.
Copyright © 2013 Biophysical Society. Published by Elsevier Inc. All rights reserved.
Figures

Similar articles
-
Monitoring of an ATP-binding aptamer and its conformational changes using an α-hemolysin nanopore.Small. 2011 Jan 3;7(1):87-94. doi: 10.1002/smll.201001428. Small. 2011. PMID: 21086519
-
A universal strategy for aptamer-based nanopore sensing through host-guest interactions inside α-hemolysin.Angew Chem Int Ed Engl. 2015 Jun 22;54(26):7568-71. doi: 10.1002/anie.201502047. Epub 2015 May 12. Angew Chem Int Ed Engl. 2015. PMID: 25966821
-
Characterization of enhanced monovalent and bivalent thrombin DNA aptamer binding using single molecule force spectroscopy.Biophys J. 2011 Oct 5;101(7):1781-7. doi: 10.1016/j.bpj.2011.07.054. Biophys J. 2011. PMID: 21961605 Free PMC article.
-
Recent Advances in Aptamer-Based Nanopore Sensing at Single-Molecule Resolution.Chem Asian J. 2022 Aug 15;17(16):e202200364. doi: 10.1002/asia.202200364. Epub 2022 Jun 23. Chem Asian J. 2022. PMID: 35644914 Review.
-
Investigations on the interface of nucleic acid aptamers and binding targets.Analyst. 2018 Nov 5;143(22):5317-5338. doi: 10.1039/c8an01467a. Analyst. 2018. PMID: 30357118 Review.
Cited by
-
Nanopores suggest a negligible influence of CpG methylation on nucleosome packaging and stability.Nano Lett. 2015 Jan 14;15(1):783-90. doi: 10.1021/nl504522n. Epub 2014 Dec 12. Nano Lett. 2015. PMID: 25495735 Free PMC article.
-
Resolved single-molecule detection of individual species within a mixture of anti-biotin antibodies using an engineered monomeric nanopore.ACS Nano. 2015 Feb 24;9(2):1089-98. doi: 10.1021/nn506606e. Epub 2015 Jan 22. ACS Nano. 2015. PMID: 25575121 Free PMC article.
-
Sensing with Nanopores and Aptamers: A Way Forward.Sensors (Basel). 2020 Aug 11;20(16):4495. doi: 10.3390/s20164495. Sensors (Basel). 2020. PMID: 32796729 Free PMC article. Review.
-
Label-free optical detection of biomolecular translocation through nanopore arrays.ACS Nano. 2014 Oct 28;8(10):10774-81. doi: 10.1021/nn504551d. Epub 2014 Sep 22. ACS Nano. 2014. PMID: 25232895 Free PMC article.
-
Nanopore sensing of individual transcription factors bound to DNA.Sci Rep. 2015 Jun 25;5:11643. doi: 10.1038/srep11643. Sci Rep. 2015. PMID: 26109509 Free PMC article.
References
-
- Tuerk C., Gold L. Systematic evolution of ligands by exponential enrichment: RNA ligands to bacteriophage T4 DNA polymerase. Science. 1990;249:505–510. - PubMed
-
- Ellington A.D., Szostak J.W. In vitro selection of RNA molecules that bind specific ligands. Nature. 1990;346:818–822. - PubMed
-
- Baldrich E., Restrepo A., O’Sullivan C.K. Aptasensor development: elucidation of critical parameters for optimal aptamer performance. Anal. Chem. 2004;76:7053–7063. - PubMed
-
- Song S., Wang L., Zhao J. Aptamer-based biosensors. Trends Analyt. Chem. 2008;27:108–117.
Publication types
MeSH terms
Substances
LinkOut - more resources
Full Text Sources
Other Literature Sources
