. 2013 Sep 6:14:603.
doi: 10.1186/1471-2164-14-603.

Screening of a Brassica napus bacterial artificial chromosome library using highly parallel single nucleotide polymorphism assays

Affiliations

Screening of a Brassica napus bacterial artificial chromosome library using highly parallel single nucleotide polymorphism assays

Hieu Xuan Cao et al. BMC Genomics. .

Abstract

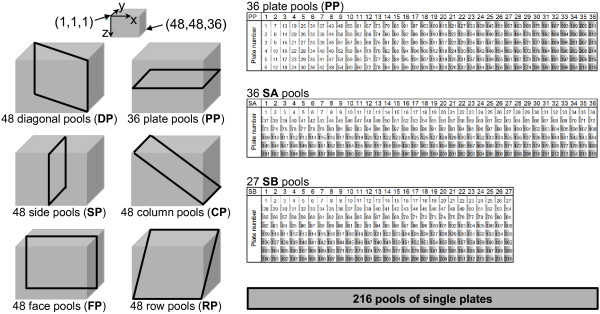
Background: Efficient screening of bacterial artificial chromosome (BAC) libraries with polymerase chain reaction (PCR)-based markers is feasible provided that a multidimensional pooling strategy is implemented. Single nucleotide polymorphisms (SNPs) can be screened in multiplexed format, therefore this marker type lends itself particularly well for medium- to high-throughput applications. Combining the power of multiplex-PCR assays with a multidimensional pooling system may prove to be especially challenging in a polyploid genome. In polyploid genomes two classes of SNPs need to be distinguished, polymorphisms between accessions (intragenomic SNPs) and those differentiating between homoeologous genomes (intergenomic SNPs). We have assessed whether the highly parallel Illumina GoldenGate Genotyping Assay is suitable for the screening of a BAC library of the polyploid Brassica napus genome.

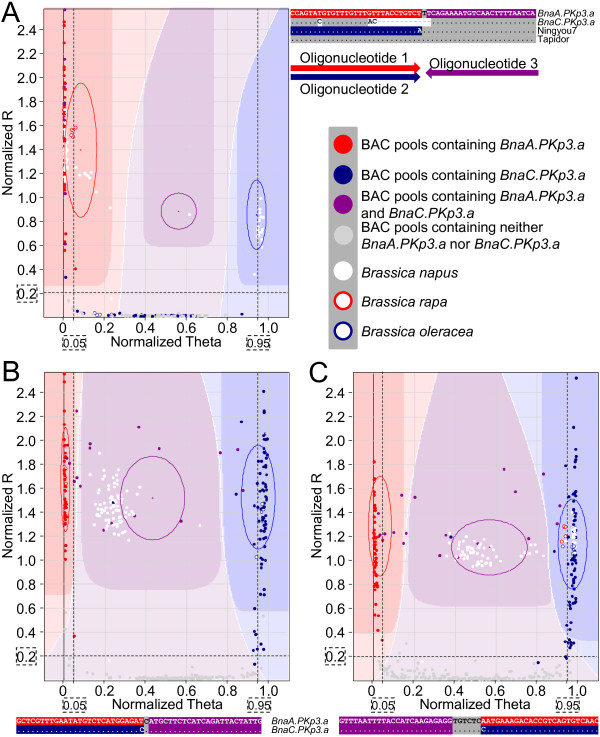
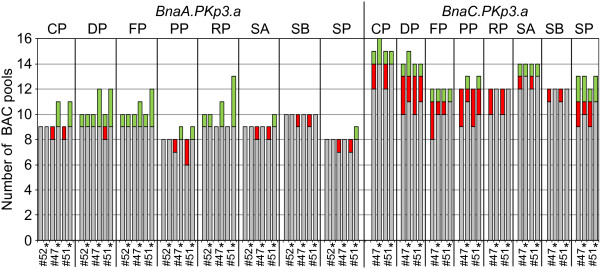
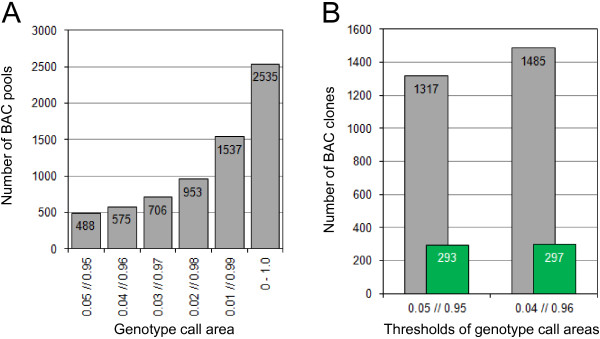
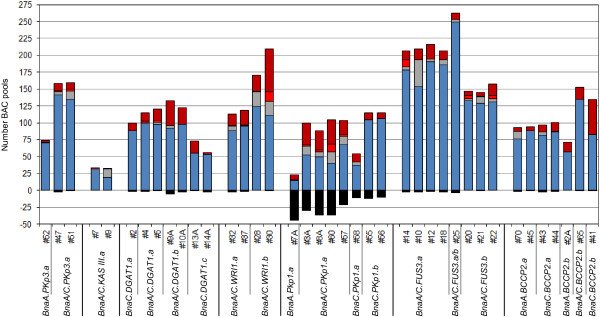
Results: A multidimensional screening platform was developed for a Brassica napus BAC library which is composed of almost 83,000 clones. Intragenomic and intergenomic SNPs were included in Illumina's GoldenGate Genotyping Assay and both SNP classes were used successfully for screening of the multidimensional BAC pools of the Brassica napus library. An optimized scoring method is proposed which is especially valuable for SNP calling of intergenomic SNPs. Validation of the genotyping results by independent methods revealed a success of approximately 80% for the multiplex PCR-based screening regardless of whether intra- or intergenomic SNPs were evaluated.

Conclusions: Illumina's GoldenGate Genotyping Assay can be efficiently used for screening of multidimensional Brassica napus BAC pools. SNP calling was specifically tailored for the evaluation of BAC pool screening data. The developed scoring method can be implemented independently of plant reference samples. It is demonstrated that intergenomic SNPs represent a powerful tool for BAC library screening of a polyploid genome.


Figures

Figure 1
Figure 1
Multidimensional BAC pooling. Two-hundred sixteen 384-well microtiter plates were arranged in a cube consisting of 36 layers of six plates each. The clones were pooled according to their position in the cube along the six distinct coordinate axes. In total, 276 six-dimensional pools were generated. The SA and SB pools were generated according to the scheme shown by combining clones of six and eight plates, respectively. For the screening of all eight dimensions 339 pools had to be analyzed. An additional dimension consisted of 216 pools that contained clones of single 384-well microtiter plates.
Figure 2
Figure 2
Analysis of BAC pools and Brassica accessions with oligonucleotide pool assays. The sequences represent those that were established for the genes found in the Express genome unless indicated otherwise. Panel (A) shows the results for SNP assay #52 which was specific for BnaA.PKp3.a. In this intragenomic SNP assay oligonucleotide 1 corresponds to an allele which was found for example in the genotypes Express and Tapidor, whereas oligonucleotide 2 matched the allele present in the Ningyou7 genome. The darker colored regions in the graphs correspond to genotype call areas which were defined by GenomeStudio Data Analysis Software v2011.1, in the red and blue areas all plants homozygous for the Express and Ningyou7 alleles were found, respectively. Heterozygous plants showed up in the purple area. The results for SNP assays #51 and #47 are displayed in panels (B) and (C), respectively. Oligonucleotides 1 and 2 of intergenomic assays #51 and #47 discriminated between homoeologous genes BnaA.PKp3.a and BnaC.PKp3.a. In all graphs the data points for the BAC pools were color-coded according to the information which was deduced from the BAC coordinates that had been identified via colony hybridization and locus assignment studies. The dashed lines and boxed values correspond to the thresholds which were implemented for the optimized scoring method.
Figure 3
Figure 3
Scoring of BAC pools for the presence of SNPs with two methods. The coordinates of BAC clones which were shown to contain genes BnaA.PKp3.a and BnaC.PKp3.a according to the results of colony hybridizations and locus assignment studies served as reference for the scoring of the BAC pools with oligonucleotide pool SNP assays. The results of the optimized scoring method (for details please refer to the text) are marked with stars the other data were obtained with the clustering algorithm in GenomeStudio Data Analysis Software v2011.1. Grey shading indicates the number of BAC pools that were identified with a particular SNP assay (#…) and corresponded to known BAC coordinates. Red boxes refer to the number of BAC pools representing known BAC coordinates but that were not detected with the SNP assays. Green shading highlights the number of identified pools that did not coincide with known BAC coordinates. The pools of the different dimensions are abbreviated in the same way as shown in Figure 1.
Figure 4
Figure 4
Defining the thresholds of the genotype call areas. The bars in panel (A) show how the thresholds for the genotype call areas affected the number of BAC pools that were assigned to the category containing both SNPs. In panel (B) the grey bars show the total number of putative BAC clones which resulted if two different sets of thresholds were applied to define the genotype call areas. The green bars correspond to the BAC clones which were confirmed to contain the loci of interest. Results for the 20 intergenomic assays listed in Additional file 2A were taken into account for the analysis represented in the two panels.
Figure 5
Figure 5
Summary of screening results for BAC pools of the Brassica napus BAC library. The black boxes represent the pools of known BAC coordinates which were not scored because their normalized R value was lower than 0.2. The total area covered by the blue, grey, red and brown bars corresponds to the total number of BAC pools for which genotypes were assigned with the different SNP assays (#…) used. BAC pools that belonged to known BAC coordinates are shown as blue, grey and red bars. Blue bars correspond to pools for which the SNP assignment was consistent with that expected for the known coordinates. The grey bars represent pools which were assigned to the class containing both SNPs, whereas a single SNP would be predicted based on the information for the known clones. Pools with a SNP classification that caused the omission of known BAC coordinates from the list of putative clones are shown as red bars. The brown bars represent pools that did not belong to known BAC coordinates.

References

    1. Lagercrantz U, Lydiate DJ. Comparative genome mapping in Brassica. Genetics. 1996;144:1903–1910. - PMC - PubMed
    1. Lagercrantz U. Comparative mapping between Arabidopsis thaliana and Brassica nigra indicates that Brassica genomes have evolved through extensive genome replication accompanied by chromosome fusions and frequent rearrangements. Genetics. 1998;150:1217–1228. - PMC - PubMed
    1. Parkin IA, Gulden SM, Sharpe AG, Lukens L, Trick M, Osborn TC, Lydiate DJ. Segmental structure of the Brassica napus genome based on comparative analysis with Arabidopsis thaliana. Genetics. 2005;171:765–781. doi: 10.1534/genetics.105.042093. - DOI - PMC - PubMed
    1. O’Neill CM, Bancroft I. Comparative physical mapping of segments of the genome of Brassica oleracea var. alboglabra that are homoeologous to sequenced regions of chromosomes 4 and 5 of Arabidopsis thaliana. Plant J. 2000;23:233–243. doi: 10.1046/j.1365-313x.2000.00781.x. - DOI - PubMed
    1. Rana D, van den-Boogaart T, O'Neill CM, Hynes L, Bent E, Macpherson L, Park JY, Lim YP, Bancroft I. Conservation of the microstructure of genome segments in Brassica napus and its diploid relatives. Plant J. 2004;40:725–733. doi: 10.1111/j.1365-313X.2004.02244.x. - DOI - PubMed

Publication types