. 2013 Nov;119(5):1208-20.
doi: 10.3171/2013.8.JNS122387. Epub 2013 Sep 6.

Nonthermal ablation with microbubble-enhanced focused ultrasound close to the optic tract without affecting nerve function

Affiliations

Nonthermal ablation with microbubble-enhanced focused ultrasound close to the optic tract without affecting nerve function

Nathan McDannold et al. J Neurosurg. 2013 Nov.

Abstract

Object: Tumors at the skull base are challenging for both resection and radiosurgery given the presence of critical adjacent structures, such as cranial nerves, blood vessels, and brainstem. Magnetic resonance imaging-guided thermal ablation via laser or other methods has been evaluated as a minimally invasive alternative to these techniques in the brain. Focused ultrasound (FUS) offers a noninvasive method of thermal ablation; however, skull heating limits currently available technology to ablation at regions distant from the skull bone. Here, the authors evaluated a method that circumvents this problem by combining the FUS exposures with injected microbubble-based ultrasound contrast agent. These microbubbles concentrate the ultrasound-induced effects on the vasculature, enabling an ablation method that does not cause significant heating of the brain or skull.

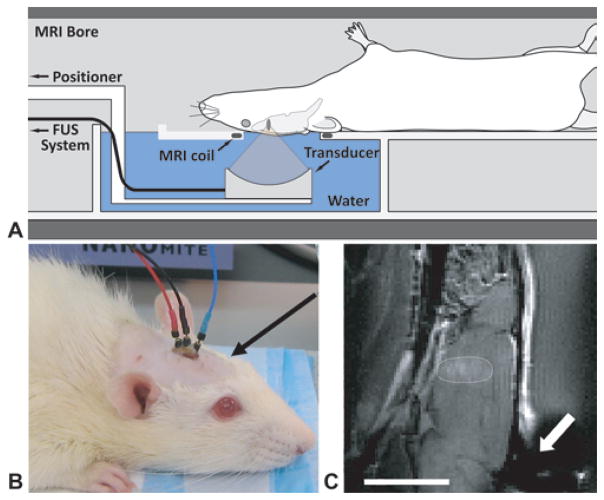
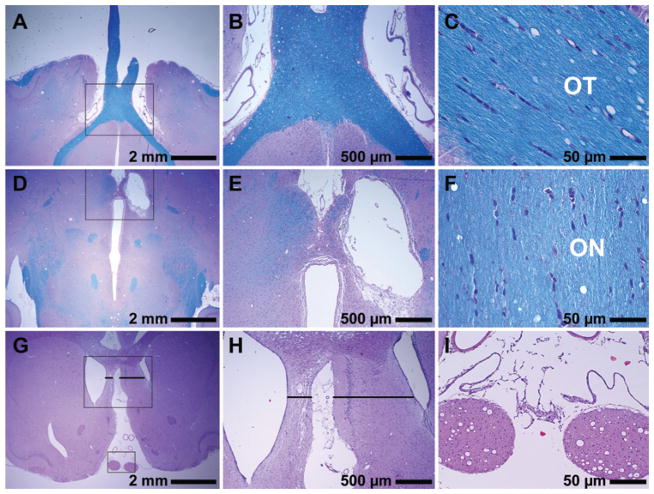
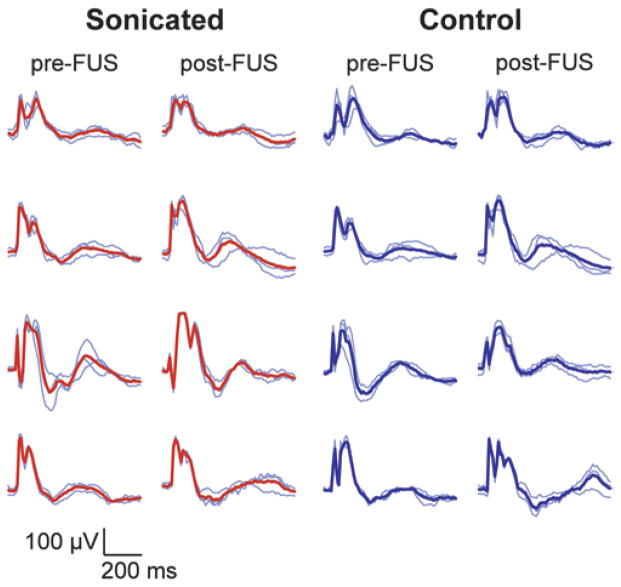
Methods: In 29 rats, a 525-kHz FUS transducer was used to ablate tissue structures at the skull base that were centered on or adjacent to the optic tract or chiasm. Low-intensity, low-duty-cycle ultrasound exposures (sonications) were applied for 5 minutes after intravenous injection of an ultrasound contrast agent (Definity, Lantheus Medical Imaging Inc.). Using histological analysis and visual evoked potential (VEP) measurements, the authors determined whether structural or functional damage was induced in the optic tract or chiasm.

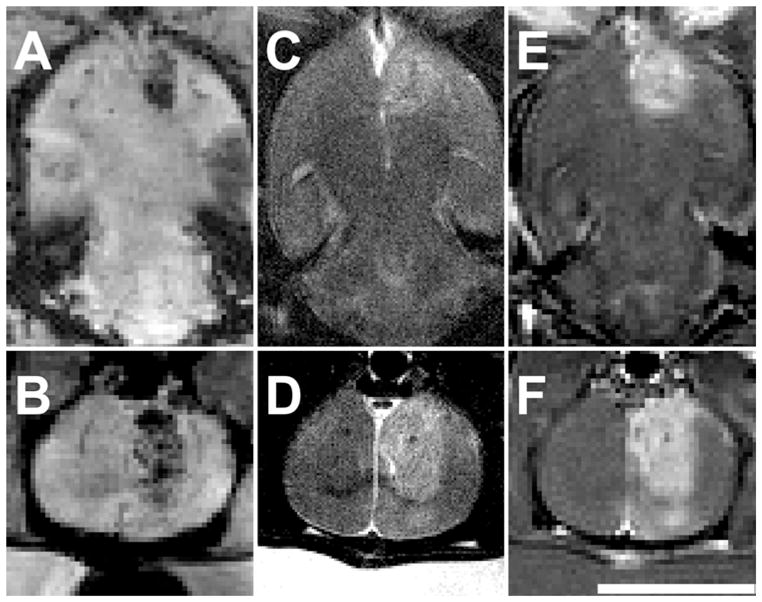
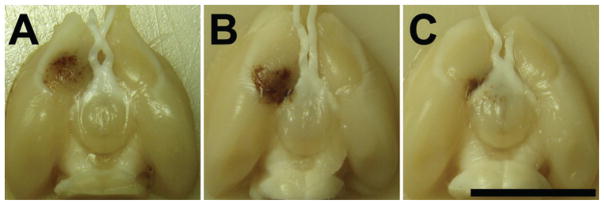
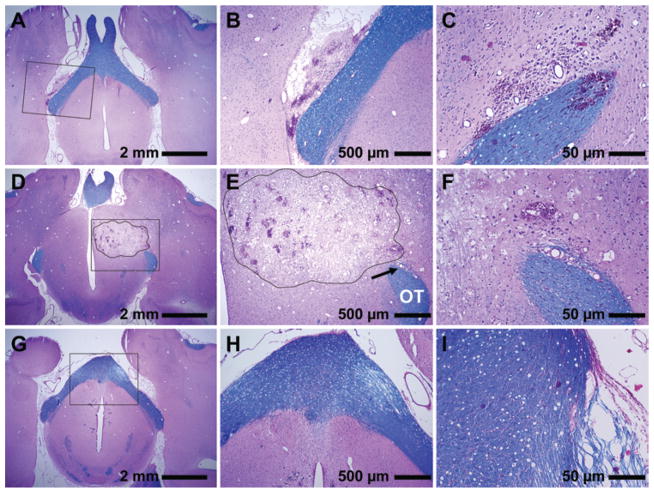
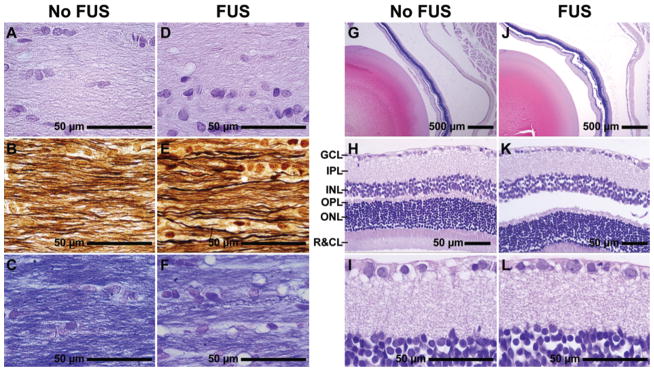
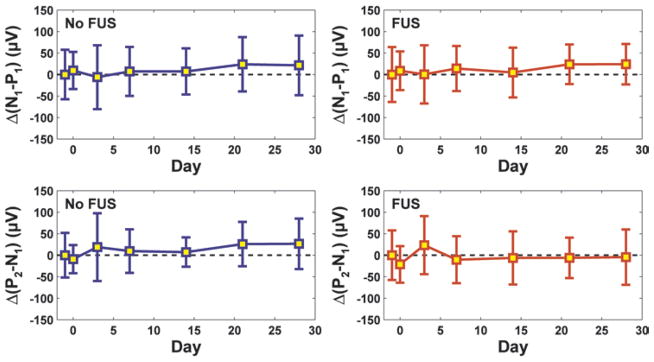
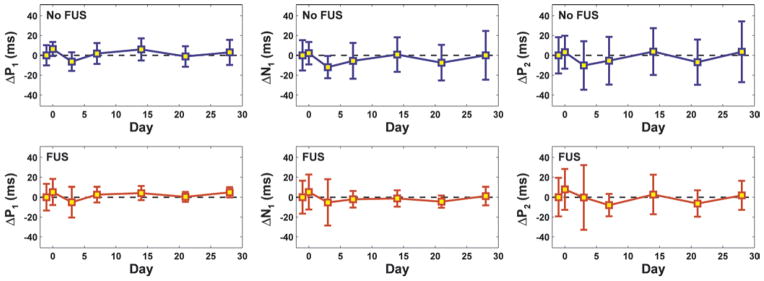
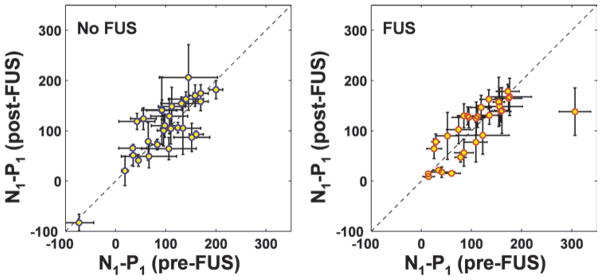
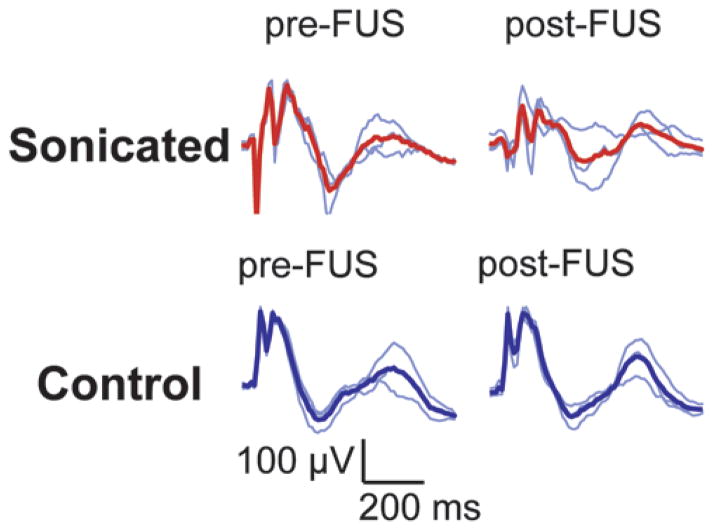
Results: Overall, while the sonications produced a well-defined lesion in the gray matter targets, the adjacent tract and chiasm had comparatively little or no damage. No significant changes (p > 0.05) were found in the magnitude or latency of the VEP recordings, either immediately after sonication or at later times up to 4 weeks after sonication, and no delayed effects were evident in the histological features of the optic nerve and retina.

Conclusions: This technique, which selectively targets the intravascular microbubbles, appears to be a promising method of noninvasively producing sharply demarcated lesions in deep brain structures while preserving function in adjacent nerves. Because of low vascularity--and thus a low microbubble concentration--some large white matter tracts appear to have some natural resistance to this type of ablation compared with gray matter. While future work is needed to develop methods of monitoring the procedure and establishing its safety at deep brain targets, the technique does appear to be a potential solution that allows FUS ablation of deep brain targets while sparing adjacent nerve structures.


Figures

Fig. 1
Fig. 1
A: Experimental setup. B: Photograph of rat with implanted epidural electrodes before a VEP recording session. Placement of the electrodes left the region above the optic chiasm or tract (arrow) intact for sonication. C: Sagittal contrast-enhanced T1-weighted FSE image obtained in a rat with a lesion at the skull base next to the optic tract (circled). There was an artifact in the image in the vicinity of the electrodes (arrow), but it did not affect the sonicated area. Bar = 1 cm.
Fig. 2
Fig. 2
Magnetic resonance images of lesions immediately after sonication at 174 kPa combined with 20 μl/kg USCA. The lesions were somewhat heterogeneous in appearance, but in general were hypointense on T2*-weighted imaging (A–B), hyper-intense on T2-weighted imaging (C–D), and enhancing on T1-weighted FSE imaging after injection of MRI contrast (E–F). This was one of the larger lesions produced, with MRI-evident effects reaching down to the dorsal brain surface. Upper images, axial views; lower images, coronal views. Bar = 1 cm.
Fig. 3
Fig. 3
Photographs of formalin-fixed brains showing the lesions produced in 3 rats. A: The edge of the lesion was approximately 1 mm from the optic chiasm. B: The edge of the lesion just touched the optic tract, and some hemorrhage was evident in the space around the tract. C: The lesion was targeted directly on the tract itself. This targeting uncertainty was thought to be due to the effect of the rat skull, which can deflect the ultrasound field depending on the incident angle between the skull surface and the beam. Bar = 1 cm.
Fig. 4
Fig. 4
Photomicrographs of sections stained with H & E (purple) and LFB (blue) showing histological findings 24–48 hours after sonication. Portion of a lesion that overlapped the edge of the optic tract (A–C). The gray matter portion was a necrotic lesion with numerous sites with extravasated erythrocytes. The optic tract itself was largely unaffected. A hemorrhagic region in the optic tract was found on a different section in this example (C). A large lesion in a different animal that directly overlapped the optic tract (OT) at the point where it exited the chiasm (D–F). In a section dorsal to the optic tract, a large continuous necrotic lesion with numerous sites of microhemorrhage was observed in the gray matter (outline, D and E). There was damage to a blood vessel with associated hemorrhage and rarefaction of the fibers in a small area of the optic tract (F). However, only a few peripheral fibers in the descending part of the optic tract appeared damaged (arrow, E) without signs of demyelination. Sections from a different animal showing damage in the chiasm (G–I). Rarefied fibers were found in the edge of the tract (G–H). Markedly rarefied fibers were found at the chiasm edge in a more ventral section (I), with a few that were necrotic and demyelinated (purple fibers). Compared with the gray matter portion of the lesions, damage in the tract was substantially less; myelin preservation (blue) was observed in most fibers. Panels B, E, and H are magnified views of insets in A, D, and G, respectively. Panels C and I are different sections of the brains featured in A and G, respectively. Panel F is a magnified view of the area indicated by the arrow in E.
Fig. 5
Fig. 5
Photomicrographs showing histological features in 3 animals 3–4 weeks after sonication. A–C: In this example, the lesion observed on MRI adjacent to the chiasm was largely resolved at 3 weeks, and fibers in the optic nerves, chiasm, and tract (OT) appeared normal. D–F: In this animal, the lesion developed into a fluid-filled cyst. The optic nerve (ON), chiasm, and adjacent optic tract were unaffected. G–I: Coronal section of a third animal. In this case, macrophages and histiocytes almost completely resorbed the damaged tissues, resulting in shrinkage of the affected area and enlargement of the ventricle. Transverse sections of optic nerves (I) showed no evident abnormalities. Panels B, E, and H are magnified views of insets in A, D, and G, respectively. Panels C, F, and I are views of different sections in the same 3 respective brains. H & E and LFB (A–F); H & E (G–I).
Fig. 6
Fig. 6
Photomicrographs showing histological features of the optic nerve and retina 4 weeks after sonication. A–F: Longitudinal optic nerve sections stained with H & E (A and D), Bielschowsky silver impregnation (B and E), and LFB (C and F). Optic nerves showed normal axonal size and fiber distribution. No demyelination or axonal loss was observed. G–L: Retinal histological features in sections stained with cresyl violet. No degenerative changes were apparent, and the retinal ganglion cell layer appears normal without any evident cell loss. The apparent separation of the retina from the epithelium, enlarged inter- and intracellular spaces, and lack of cellular detail were observed in both treated (FUS) and control (No FUS) eyes and were presumably artifacts resulting from formalin fixation. GCL = ganglion cell layer; IPL = inner plexiform layer; INL = inner nuclear layer; OPL = outer plexiform layer; ONL = outer nuclear layer; R&CL = photoreceptor layer: rods and cones.
Fig. 7
Fig. 7
Example VEP measurements acquired from 4 animals before and at different times (48 hours–3 weeks) after sonication (174 kPa and 20 μl/kg USCA) in 1 hemisphere on or adjacent to the optic tract. Each row of traces was obtained in 1 animal. A location on or adjacent to the optic tract in 1 hemisphere was sonicated; the other hemisphere served as a control. Thin blue lines are single measurements (average of recordings obtained during 256 light flashes). Thick red lines or thick blue lines show the average of these 3 measurements. While there was variation in the shape of the curves from animal to animal, it is clear that the measurements in these animals were not substantially changed because of the sonications.
Fig. 8
Fig. 8
The mean difference (Δ) between post- and pre-FUS magnitudes of early components in the VEP measurement as a function of time for all animals in this study (means ± SDs). No significant differences (p > 0.05) were found between the pre- and post-FUS measurements at any time point. Measurements obtained in sonicated animals appear in red; those made in control animals appear in blue.
Fig. 9
Fig. 9
The mean difference (Δ) between post- and pre-FUS latencies of early components in the VEP measurement as a function of time for all animals tested (means ± SDs). No significant differences (p > 0.05) were found between the pre- and post-FUS measurements at any time point. Measurements obtained in sonicated animals appear in red; those made in control animals appear in blue.
Fig. 10
Fig. 10
Scatterplots of post- versus pre-FUS measurements of the magnitude of the first VEP components (N1-P1) for all of the rats (nonsonicated control hemisphere, left; sonicated hemisphere, right). Overall, there was no significant difference (p > 0.05). However, a substantial decline in magnitude was observed for 1 animal (outlier in right plot). Histological features for this example are shown in Fig. 4A–C. The hemisphere with more robust signal in the pre-FUS measurement was selected for sonication. This choice is evident by the increased variability in the plot on the left of the measurements made for the control hemisphere (means ± SDs).
Fig. 11
Fig. 11
Visual evoked potential measurements from the animal that demonstrated a functional deficit 48 hours after FUS. A clear decrement is observed in the VEP magnitude in the sonicated hemisphere, but the control measurement was unchanged. Histological features for this animal are shown in Fig. 4A–C.

Similar articles

Cited by

References

    1. Anzai Y, Lufkin R, DeSalles A, Hamilton DR, Farahani K, Black KL. Preliminary experience with MR-guided thermal ablation of brain tumors. AJNR Am J Neuroradiol. 1995;16:39–52. - PMC - PubMed
    1. Aubry JF, Tanter M, Pernot M, Thomas JL, Fink M. Experimental demonstration of noninvasive transskull adaptive focusing based on prior computed tomography scans. J Acoust Soc Am. 2003;113:84–93. - PubMed
    1. Ballantine HT, Jr, Bell E, Manlapaz J. Progress and problems in the neurological applications of focused ultrasound. J Neurosurg. 1960;17:858–876. - PubMed
    1. Bamber JC. Ultrasonic attenuation in fresh human tissues. Ultrasonics. 1981;19:187–188. - PubMed
    1. Billard BE, Hynynen K, Roemer RB. Effects of physical parameters on high temperature ultrasound hyperthermia. Ultrasound Med Biol. 1990;16:409–420. - PubMed

Publication types

LinkOut - more resources