

Autoantibodies to Ezrin are an early sign of pancreatic cancer in humans and in genetically engineered mouse models
- PMID: 24010981
- PMCID: PMC3844582
- DOI: 10.1186/1756-8722-6-67
Autoantibodies to Ezrin are an early sign of pancreatic cancer in humans and in genetically engineered mouse models
Abstract
Background: Pancreatic Ductal Adenocarcinoma (PDAC) is a highly aggressive malignancy with only a 5% 5-year survival rate. Reliable biomarkers for early detection are still lacking. The goals of this study were (a) to identify early humoral responses in genetically engineered mice (GEM) spontaneously developing PDAC; and (b) to test their diagnostic/predictive value in newly diagnosed PDAC patients and in prediagnostic sera.
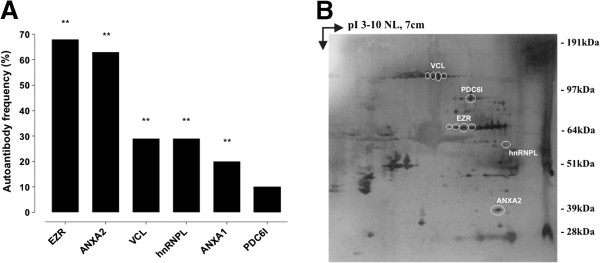
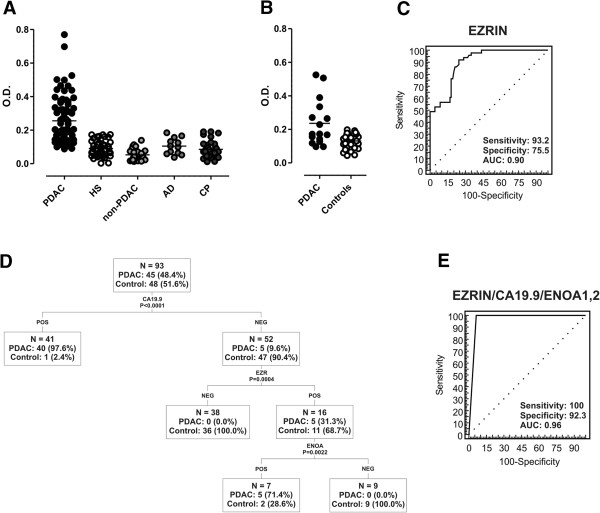
Methods and results: The serum reactivity of GEM from inception to invasive cancer, and in resectable or advanced human PDAC was tested by two-dimensional electrophoresis Western blot against proteins from murine and human PDAC cell lines, respectively. A common mouse-to-human autoantibody signature, directed against six antigens identified by MALDI-TOF mass spectrometry, was determined. Of the six antigens, Ezrin displayed the highest frequency of autoantibodies in GEM with early disease and in PDAC patients with resectable disease. The diagnostic value of Ezrin-autoantibodies to discriminate PDAC from controls was further shown by ELISA and ROC analyses (P < 0.0001). This observation was confirmed in prediagnostic sera from the EPIC prospective study in patients who eventually developed PDAC (with a mean time lag of 61.2 months between blood drawing and PDAC diagnosis). A combination of Ezrin-autoantibodies with CA19.9 serum levels and phosphorylated α-Enolase autoantibodies showed an overall diagnostic accuracy of 0.96 ± 0.02.
Conclusions: Autoantibodies against Ezrin are induced early in PDAC and their combination with other serological markers may provide a predictive and diagnostic signature.
Figures
Similar articles
-
No evidence of pancreatic ductal adenocarcinoma specific autoantibodies to Ezrin in a liquid phase LIPS immunoassay.Cancer Biomark. 2018;22(2):351-357. doi: 10.3233/CBM-181218. Cancer Biomark. 2018. PMID: 29660901
-
Autoantibody signature in human ductal pancreatic adenocarcinoma.J Proteome Res. 2007 Oct;6(10):4025-31. doi: 10.1021/pr070281a. Epub 2007 Sep 8. J Proteome Res. 2007. PMID: 17824682
-
Circulating autoantibodies to phosphorylated α-enolase are a hallmark of pancreatic cancer.J Proteome Res. 2011 Jan 7;10(1):105-12. doi: 10.1021/pr100213b. Epub 2010 Jun 10. J Proteome Res. 2011. PMID: 20455595
-
Identification and validation of a novel autoantibody biomarker panel for differential diagnosis of pancreatic ductal adenocarcinoma.Front Immunol. 2025 Jan 30;16:1494446. doi: 10.3389/fimmu.2025.1494446. eCollection 2025. Front Immunol. 2025. PMID: 39949781 Free PMC article.
-
Simple Serum Pancreatic Ductal Adenocarcinoma (PDAC) Protein Biomarkers-Is There Anything in Sight?J Clin Med. 2021 Nov 22;10(22):5463. doi: 10.3390/jcm10225463. J Clin Med. 2021. PMID: 34830745 Free PMC article. Review.
Cited by
-
Serum anti-CFL1, anti-EZR, and anti-CYPA autoantibody as diagnostic markers in ovarian cancer.Sci Rep. 2024 Apr 29;14(1):9757. doi: 10.1038/s41598-024-60544-2. Sci Rep. 2024. PMID: 38684875 Free PMC article.
-
Urine biomarkers enable pancreatic cancer detection up to 2 years before diagnosis.Int J Cancer. 2023 Feb 15;152(4):769-780. doi: 10.1002/ijc.34287. Epub 2022 Sep 23. Int J Cancer. 2023. PMID: 36093581 Free PMC article.
-
Immune-complex level of cofilin-1 in sera is associated with cancer progression and poor prognosis in pancreatic cancer.Cancer Sci. 2017 Apr;108(4):795-803. doi: 10.1111/cas.13181. Cancer Sci. 2017. PMID: 28161904 Free PMC article.
-
Use of Autoreactive Antibodies in Blood of Patients with Pancreatic Intraductal Papillary Mucinous Neoplasms (IPMN) for Grade Distinction and Detection of Malignancy.Cancers (Basel). 2022 Jul 22;14(15):3562. doi: 10.3390/cancers14153562. Cancers (Basel). 2022. PMID: 35892825 Free PMC article.
-
The Mutant p53-Driven Secretome Has Oncogenic Functions in Pancreatic Ductal Adenocarcinoma Cells.Biomolecules. 2020 Jun 9;10(6):884. doi: 10.3390/biom10060884. Biomolecules. 2020. PMID: 32526853 Free PMC article.
References
Publication types
MeSH terms
Substances
LinkOut - more resources
Full Text Sources
Other Literature Sources
Medical
Research Materials
