. 2013 Oct 2;80(1):198-209.
doi: 10.1016/j.neuron.2013.07.023. Epub 2013 Sep 5.

Environmental enrichment rescues binocular matching of orientation preference in mice that have a precocious critical period

Affiliations

Environmental enrichment rescues binocular matching of orientation preference in mice that have a precocious critical period

Bor-Shuen Wang et al. Neuron. .

Abstract

Experience shapes neural circuits during critical periods in early life. The timing of critical periods is regulated by both genetics and the environment. Here we study the functional significance of such temporal regulations in the mouse primary visual cortex, where critical period plasticity drives binocular matching of orientation preference. We find that the binocular matching is permanently disrupted in mice that have a precocious critical period due to genetically enhanced inhibition. The disruption is specific to one type of neuron, the complex cells, which, as we reveal, normally match after the simple cells. Early environmental enrichment completely rescues the deficit by inducing histone acetylation and consequently advancing the matching process to coincide with the precocious plasticity. Our experiments thus demonstrate that the proper timing of the critical period is essential for establishing normal binocularity and the detrimental impact of its genetic misregulation can be ameliorated by environmental manipulations via epigenetic mechanisms.


Figures

Figure 1
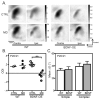
Figure 1. Disrupted binocular matching in mice with precocious critical period plasticity
(A) Polar plots of orientation tuning curves of a V1 neuron in BDNF-OE mice. The neuron prefers different orientations through the contralateral (“Contra”) and ipsilateral (“Ipsi”) eye. (B) Cumulative distribution of ΔO for WT and BDNF-OE mice. The dotted line represents a uniform distribution if the matching were completely random. (C) Mean ΔO of WT, BDNF-OE mice and random matching (45°). (D) Normal binocular matching in simple cells of BDNF-OE and diazepam-treated WT mice, compared to WT and vehicle controls. (E) Disrupted binocular matching in complex cells of BDNF-OE and diazepam-treated WT mice. (F–G). Mean monocular tuning curves through contralateral (F) and ipsilateral (G) eyes for BDNF-OE and WT mice. Error bars represent mean ± SEM (*p < 0.05, **p < 0.01, ***p < 0.001). See also Figure S1 and Table S1.
Figure 2
Figure 2. Simple cells match binocular orientation preference before complex cells
(A) Cumulative distribution of ΔO for simple cells in five age groups during development: P15–18, P20/21, P22/23, P26/27, P31–36. (B) Mean ΔO of simple cells is high at P15–18 and P20/21, similar to the dark-reared (DR) mice, then decreases and reaches the mature level by P22/23. (C) Mean OSI of simple cells increases during development for both contralateral (P15–18 vs. P31–36, P < 0.05) and ipsilateral (P15–18 vs. P31–36, P = 0.06; P20/21 vs. P31–36, P < 0.001) eyes. (D) Cumulative distribution of ΔO for complex cells in all five age groups during development. (E) Mean ΔO of complex cells is high from P15 to P27, very similar to the DR group. It decreases after P27 and reaches mature level by P31–36. (F) Mean OSI of complex cells remains similar during development for both contralateral (P15–18 vs. P31–36, P = 0.79) and ipsilateral (P15–18 vs. P31–36, P = 0.50) eyes. Error bars represent mean ± SEM (*p < 0.05, **p < 0.01, ***p < 0.001). See also Table S1.
Figure 3
Figure 3. Precocious cortical plasticity does not advance binocular matching in BDNF-OE mice
(A) Examples of response magnitude maps from WT (left) and BDNF-OE mice (right), without MD (top row, imaged at P20), or with 5 days of MD from P15 to P20 (bottom row). (B) A shift in ocular dominance is seen in BDNF-OE mice with 5–6 days of MD starting at P15 (Mann-Whitney rank sum test: p < 0.01), but not in WT mice. (C) Mean ΔO of both simple and complex cells in P20/21 BDNF-OE mice is similarly high as in age-matched WT controls. Error bars represent mean ± SEM (**p < 0.01).
Figure 4
Figure 4. Environmental enrichment advances binocular matching and rescues the deficit in BDNF-OE mice
(A–B) Mean ΔO of simple (A) and complex (B) cells in WT mice reared in normal (NR) and enriched environment (EE). Binocular matching improves significantly and reaches adult level by P20/21. (C–D) Mean ΔO of simple (C) and complex (D) cells in BDNF-OE mice reared in normal and enriched environment. (E–F) Mean ΔO of simple (E) and complex (F) in mice reared in EE from birth to P17, and then followed by NR (EE-NR). Error bars represent mean ± SEM (*p < 0.05, **p < 0.01, ***p < 0.001). See also Figure S2, Table S1 and Movie S1.
Figure 5
Figure 5. IGF-1 advances binocular matching and rescues the matching deficit in BDNF-OE mice
(A) EE induces slightly earlier eye opening (WT-NR: mean = 13.4 ± 0.1 days, n = 53 mice; WT-EE: mean = 12.9 ± 0.1 days, n = 61; Mann-Whitney rank sum test: p < 0.01). (B) Examples of response magnitude maps from enriched WT mice (WT-EE), with strong contralateral bias in control (top row, imaged at P20) and more balanced responses after depriving the contralateral eye from P15 to P20 (bottom row). (C) A significant shift in ocular dominance index (ODI) is seen in the WT-EE mice after 5–6 days of MD starting at P15 (Mann-Whitney rank sum test: p < 0.01). (D) Mean ΔO of all (left), simple (center), and complex (right) cells in vehicle (0.1% BSA, open bars) and IGF-1 (black bars) treated P20/21 WT. The unmanipulated P20/21 and P31–90 groups are shown in the gray bars to illustrate the normal level of binocular matching at the two ages for comparison. (E) Mean ΔO of all (left), simple (center), and complex (right) cells in vehicle (0.1% BSA, open bars) and IGF-1 (black bars) treated P31–38 BDNF-OE mice. Error bars represent mean ± SEM (*p < 0.05, **p < 0.01, ***p < 0.001). See also Figure S4 and Table S1.
Figure 6
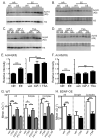
Figure 6. Environmental enrichment induces acetylation of histone H4 to advance binocular matching
(A) Representative images of Western blots for acetylated H4K5 (top) and total H4 (bottom) in the visual cortex of normal-reared (NR) and EE mice. (B) Representative Western blots for acetylated H3K9 (top) and total H3 (bottom) in NR and EE mice. (C–D) Representative Western blots for acetylated and total H4 (C) and H3 (D) in IGF-1 and TSA treated mice. (E–F) Quantification of relative levels of acetylated H4K5 (E) and H3K9 (F). Each group included both WT and BDNF-OE (OE) mice and was normalized by the mean of the unmanipulated samples on the same gel. T-test was used to compare NR vs. EE; 1-way ANOVA and Tukey post test was used to compare vehicle (veh), IGF-1, and TSA-treated mice. In E, NR: n = 16 (8 mice); EE: n = 20 (8); veh, n = 4 (2); IGF-1, n = 8 (4); and TSA, n = 10 (5). In F, NR: n = 15 (8); EE: n = 19 (8); veh, n = 4 (2); IGF-1, n = 8 (4); and TSA, n = 10 (5). (G) Mean ΔO of all (left), simple (center), and complex (right) cells in vehicle (0.5% DMSO, open bars) and TSA injected (black bars) WT mice. The unmanipulated P20/21 and P31–90 groups (grey bars) are shown to illustrate the normal level of binocular matching at the two ages for comparison. (H) Mean ΔO of all (left), simple (center), and complex (right) cells in vehicle (0.5% DMSO, open bars) and TSA treated (black bars) P31–38 BDNF-OE mice. Error bars represent mean ± SEM (*p < 0.05, **p < 0.01, ***p < 0.001). See also Figure S4 and Table S1.

Similar articles

Cited by

References

    1. Alonso JM, Martinez LM. Functional connectivity between simple cells and complex cells in cat striate cortex. Nat Neurosci. 1998;1:395–403. - PubMed
    1. Baroncelli L, Braschi C, Spolidoro M, Begenisic T, Maffei L, Sale A. Brain plasticity and disease: a matter of inhibition. Neural Plast. 2011;2011:286073. - PMC - PubMed
    1. Baroncelli L, Sale A, Viegi A, Maya Vetencourt JF, De Pasquale R, Baldini S, Maffei L. Experience-dependent reactivation of ocular dominance plasticity in the adult visual cortex. Exp Neurol. 2010;226:100–109. - PubMed
    1. Begenisic T, Spolidoro M, Braschi C, Baroncelli L, Milanese M, Pietra G, Fabbri ME, Bonanno G, Cioni G, Maffei L, Sale A. Environmental enrichment decreases GABAergic inhibition and improves cognitive abilities, synaptic plasticity, and visual functions in a mouse model of Down syndrome. Front Cell Neurosci. 2011;5:29. - PMC - PubMed
    1. Brainard MS, Knudsen EI. Sensitive periods for visual calibration of the auditory space map in the barn owl optic tectum. J Neurosci. 1998;18:3929–3942. - PMC - PubMed

Publication types

LinkOut - more resources