. 2013 Sep 19;39(3):611-21.
doi: 10.1016/j.immuni.2013.08.025. Epub 2013 Sep 5.

Myeloid-derived suppressor cells enhance stemness of cancer cells by inducing microRNA101 and suppressing the corepressor CtBP2

Affiliations

Myeloid-derived suppressor cells enhance stemness of cancer cells by inducing microRNA101 and suppressing the corepressor CtBP2

Tracy X Cui et al. Immunity. .

Abstract

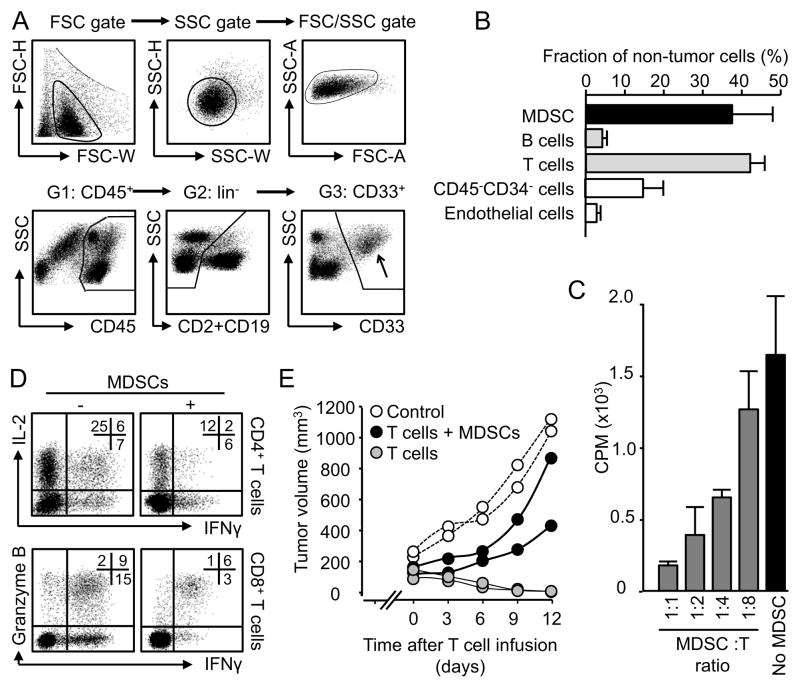
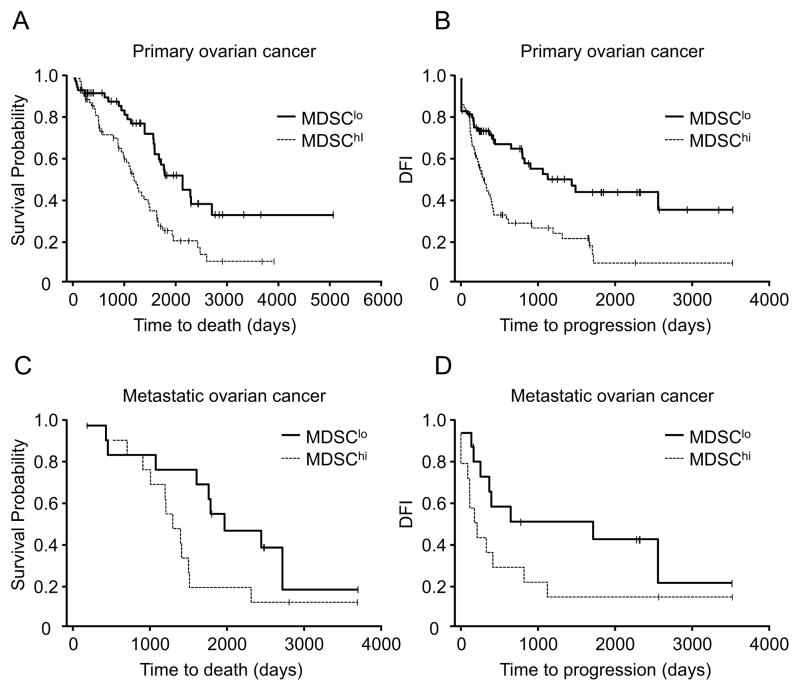
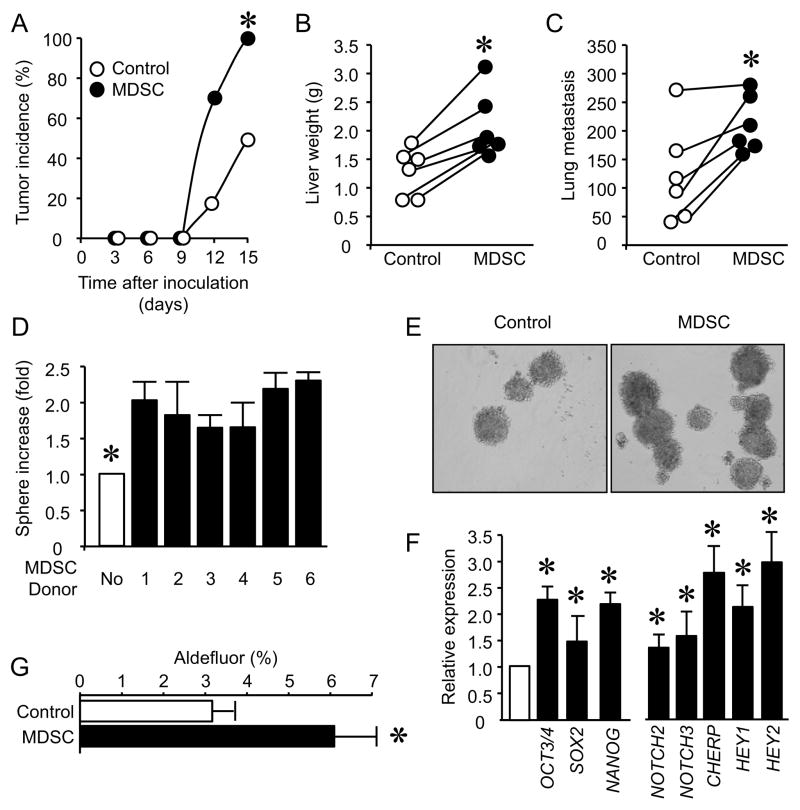
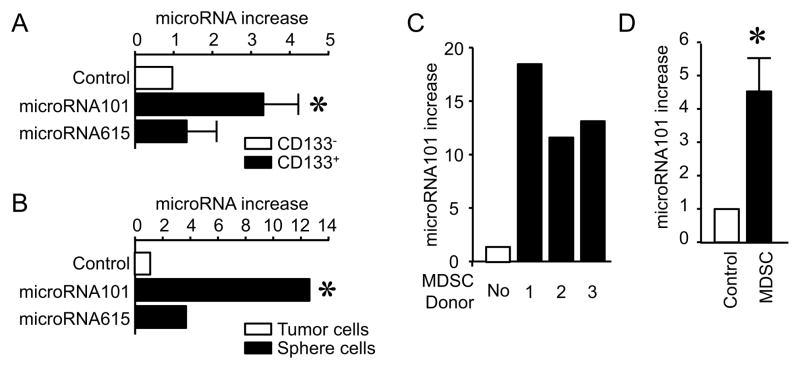
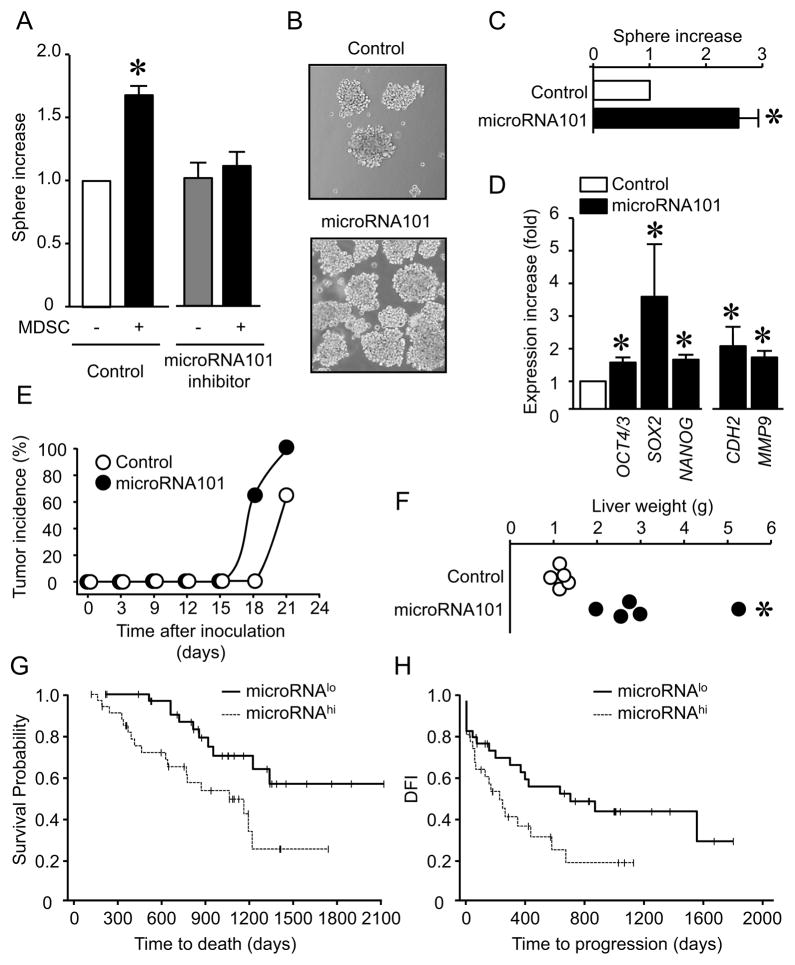
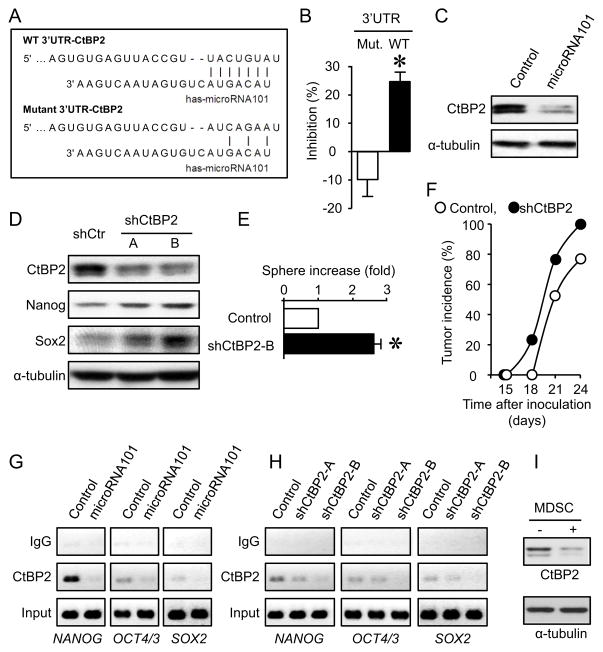
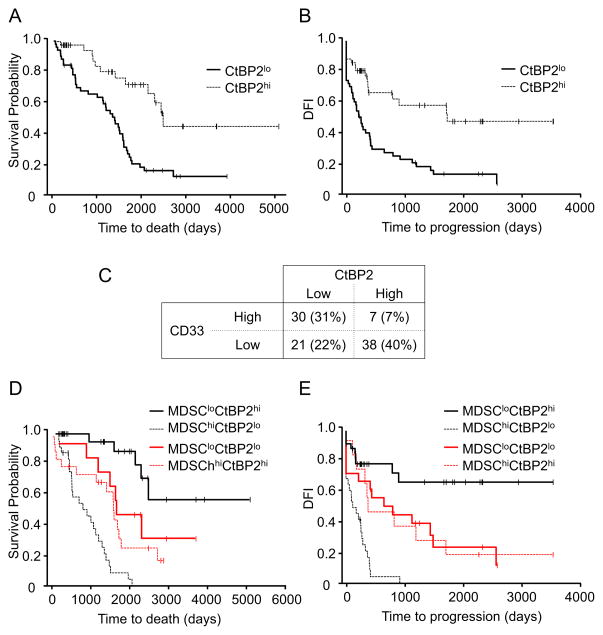
Myeloid-derived suppressor cells (MDSCs) and cancer stem cells (CSCs) are important cellular components in the cancer microenvironment and may affect cancer phenotype and patient outcome. The nature of MDSCs and their interaction with CSCs in ovarian carcinoma are unclear. We examined the interaction between MDSCs and CSCs in patients with ovarian carcinoma and showed that MDSCs inhibited T cell activation and enhanced CSC gene expression, sphere formation, and cancer metastasis. MDSCs triggered miRNA101 expression in cancer cells. miRNA101 subsequently repressesed the corepressor gene C-terminal binding protein-2 (CtBP2), and CtBP2 directly targeted stem cell core genes resulting in increased cancer cell stemness and increasing metastatic and tumorigenic potential. Increased MDSC density and tumor microRNA101 expression predict poor survival, as does decreased tumor CtBP2 expression, independent of each other. Collectively, our work identifies an immune-associated cellular, molecular, and clinical network involving MDSCs-microRNA101-CtBP2-stem cell core genes, which extrinsically controls cancer stemness and impacts patient outcome.


Conflict of interest statement

The authors declare no competing financial interests.

Figures

Figure 1
Figure 1. MDSCs in patients with ovarian cancer
Single cells of ovarian cancer tissues were stained for relevant markers. Doublets and apoptotic cells were gated out. (A) Flow cytometry gate of MDSCs. MDSCs were gated at the basis of their size, localization (FSC/SSC) and phenotypes (CD45+CD2CD19CD33+). Arrow pointed to gated MDSCs. One of 40 cancers is shown. (B) Percentage of non-tumor cells in fresh ovarian cancer tissues. Results are expressed as the mean percentage + SEM. n = 10. (C, D) MDSCs mediated immune suppression in vitro. Autologous T cells were cultured with MDSCs with different ratios for 3 days. T cell proliferation was determined by thymidine incorporation (C) and cytokine and granzyme B expression were analyzed by FACS (D). Results are expressed as the percent of positive cells in specific T cell subset + SEM. n = 6, P < 0.01, as compared to controls. (E) MDSCs mediated immune suppression in vivo. Autologous TAA-specific T cells were conditioned with MDSCs and injected into NSG mice bearing established ovarian cancer. Tumor volume was measured. One experiment is shown with 2 mice per group from one patient donor. Similar experiments were done in 3 patient donors. n = 6/group, P < 0.01, as compared to no MDSC and controls. See also Figure S1
Figure 2
Figure 2. Clinical impact of MDSCs in patients with ovarian cancer
MDSCs were quantified in primary and metastatic ovarian cancer. Kaplan–Meier estimates of overall survival and progression-free interval were performed according to the median values of CD33+ MDSC density. Overall survival (A, C) and disease-free interval (B, D) in patients with primary cancer (A, B) and metastatic cancer (C, D) were shown. See also Figure S2, Table S1 and S2.
Figure 3
Figure 3. MDSCs enhance ovarian cancer incidence, metastasis and stemness
(A–C) Effects of MDSCs on ovarian cancer incidence and metastasis. MDSC-conditioned primary ovarian cancer cells were subcutaneously (A) or intravenously (B, C) injected into NSG mice. Tumor development was monitored. Results are expressed as the percentage of tumor development (A). Tumor liver and lung metastasis was recorded. Results are expressed as liver weights (B) and the numbers of tumor lung foci (C). n = 6/group. P < 0.05. (D, E) Effects of MDSCs on cancer spheres formation. Primary ovarian cancer cells and MDSCs were co-cultured in sphere condition. Sphere formation assay was performed. Results are expressed as the fold of increase of sphere numbers ± SD. 6 patients with triplicates. *, P<0.01. (F) Effects of MDSCs on stem cell associated gene transcripts. Primary ovarian cancer cells were conditioned with MDSCs. Tumor stem cell associated gene transcripts were quantified with real-time PCR and are expressed as the mean values relative to controls ± SD. Five experiments with triplicates, *, P < 0.01. (G) Effects of MDSCs on ALDH+ cancer stem cells. Primary ovarian cancer cells were cultured with MDSCs for 48 hours. ALDH+ cells are expressed as the mean percentage ± SD, n = 4, derived from 3 different patients. *P <0.05. See also Figure S3
Figure 4
Figure 4. MDSCs stimulate cancer microRNA101 expression
(A) The expression of microRNA101 and microRNA615 in CD133+ and CD133 cancer cells. CD133+ and CD133 primary cancer cells were sorted from ovarian cancer tissues. microRNAs were quantified by PCR. 3 patients with triplicates are shown. Results are expressed as the mean values relative to controls ± SD. P <0.05 as compared to CD133 cancer cells. (B) The expression of microRNA101 and microRNA615 in sphere forming cancer cells. microRNAs were quantified by PCR in sphere forming cells and primary cancer cells. One of 5 experiments with triplicates is shown. *, P <0.05. (C) Effects of MDSCs on cancer microRNA101 expression in vitro. Primary ovarian cancer cells were cultured with MDSCs. Cancer microRNA101 expression was quantified by PCR. 3 patients (donor 1, 2, 3) with triplicates are shown. P <0.05 as compared to controls. (D) Effects of MDSCs on cancer microRNA101 expression in vivo. Primary ovarian cancer cells and MDSCs were injected into peritoneal cavity of NSG mice. After 24 hours, tumor cells were collected and sorted for microRNA101 detection with quantitative PCR. 3 patients with triplicates are shown. P <0.05 as compared to controls. See also Figure S4, Table S3
Figure 5
Figure 5. MDSCs promote cancer stemness via microRNA101
(A) Effect of microRNA101 inhibition on ability of forming spheres by ovarian cancer cells. Sphere assays were performed in the presence of MDSCs and microRNA101 inhibitor. 7 patients with triplicates are shown. Results are expressed as the mean values relative to controls ± SD. *, P<0.01 for testing that the effect of MDSCs depends on microRNA101. (B, C) Effects of ectopic microRNA101 on sphere formation. Sphere assays were performed in primary ovarian cancer cells transfected with lentiviral vector encoding microRNA101 and control. 3 patients with triplicates are shown. Results are expressed as the mean values relative to controls ± SD. *, P<0.01 as compared to microRNA vector. (D) Effects of ectopic microRNA101 on stem cell-associated gene transcripts. The relevant genes were quantified in primary ovarian cancer cells transfected with lentiviral vector encoding microRNA101 and control. 3 experiments with triplicates are shown. *, Results are expressed as the mean values relative to controls ± SD. P<0.01 as compared to microRNA vector. (E, F) Effects of ectopic microRNA101 on ovarian cancer incidence and metastasis. Tumor development was monitored (E). n = 6/group. Tumor liver metastasis was recorded (F). n = 5/group. P < 0.05. (G, H) Clinical relevance of microRNA101. microRNA101 was quantified by PCR in snap-frozen primary ovarian cancer. Kaplan–Meier estimates of overall survival (G) and progression-free interval (H) were performed according to the median values of microRNA101. See also Figure S5
Figure 6
Figure 6. MicroRNA101 targets CtBP2 and controls cancer stemness
(A) Target of microRNA101 in 3′UTR of CtBP2. The sequence of wild type (WT) and mutant 3′UTR of CtPB2 gene used in luciferase assay was shown. (B) Effect of microRNA101 on WT-3′UTR-CtBP2 luciferase activity. 3′UTR-CtBP2 luciferase activity was measured in tumor cells transfected with WT-3′UTR and mutant. Results are expressed as the percentage of inhibition of 3′UTR-CtBP2 luciferase activity. 3 experiments with triplicates are shown. Results are expressed as the mean percentage of inhibition ± SEM. *, P<0.01 as compared to mutant-3′UTR- CtBP2. (C) Effect of microRNA101 on CtBP2 protein expression. Primary ovarian cancer cells were transfected with lentiviral vector encoding microRNA101 and control. Cancer CtBP2 protein was detected by Western blotting. One of 3 experiments is shown. (D) Effect of CtBP2 on stem cell core protein expression in primary ovarian cancer cells. Primary ovarian cancer cells were transfected with lentiviral vector encoding shCtBP2 and control. Expression of CtBP2, Nanog, Sox2 protein was detected by Western blotting. A, B are two shCtBP2. One of 3 experiments is shown. (E) Effect of CtBP2 on ovarian cancer sphere formation. Primary ovarian cancer cells were transfected with lentiviral vector encoding shCtBP2. Sphere assay was performed in 3 experiments with triplicates. Results are expressed as the fold increase (mean + SEM). *, P<0.01 as compared to control. (F) Effect of knock down of CtBP2 expression on tumor incidence. Primary ovarian cancer cells were transfected with lentiviral vector encoding shCtBP2. shCtBP2 cancer cells were injected into NSG mice. Tumor incidence was monitored. Results are expressed as the percentage of tumor development. n = 6 in Control group; n = 5 in sh-CtBP2 group. P < 0.05. (G, H) Effects of microRNA101 on the binding of CtBP2 to core stem cell gene promoters. ChIP assay was performed in primary ovarian cancer cells expressing microRNA101 (G), shCtBP2 (H) or scramble. One of three experiments is shown. (I) Effect of MDSCs on CtBP2 protein expression in primary ovarian cancer cells. Primary ovarian cancer cells were cultured with MDSCs. CtBP2 protein expression was detected with Western blot. One of three experiments is shown. See also Figure S6
Figure 7
Figure 7. MDSCs and CtBP2 interaction impacts patient outcome
(A, B) Impact of CtBP2 on patient survival. CtBP2 expression was quantified in primary ovarian cancer. Kaplan–Meier estimates of overall survival (A) and progression-free interval (B) were performed according to the median levels of CtBP2 expression. (C) The association and distribution between tumor CtBP2 and CD33+ MDSCs in patients with ovarian carcinoma. Patients were divided into four groups: CD33lowCtBP2high, CD33lowCtBP2low, CD33highCtBP2low and CD33highCtBP2high. Patient distribution in four groups and the association between CtBP2 expression levels and CD33+ cell density are shown. (D, E) Impact of MDSC and CtBP2 interaction on ovarian cancer overall survival. Kaplan–Meier estimates of overall survival (D) and progression-free interval (E) were performed according to the median levels of CtBP2 expression and MDSC intensity. See also Figure S7

References

    1. Bartel DP. MicroRNAs: genomics, biogenesis, mechanism, and function. Cell. 2004;116:281–297. - PubMed
    1. Brabletz T, Jung A, Spaderna S, Hlubek F, Kirchner T. Opinion: migrating cancer stem cells - an integrated concept of malignant tumour progression. Nat Rev Cancer. 2005;5:744–749. - PubMed
    1. Bronte V, Zanovello P. Regulation of immune responses by L-arginine metabolism. Nat Rev Immunol. 2005;5:641–654. - PubMed
    1. Cui TX, Kwok R, Schwartz J. Cooperative regulation of endogenous cAMP-response element binding protein and CCAAT/enhancer-binding protein beta in GH-stimulated c-fos expression. J Endocrinol. 2008;196:89–100. - PubMed
    1. Curiel TJ, Coukos G, Zou L, Alvarez X, Cheng P, Mottram P, Evdemon-Hogan M, Conejo-Garcia JR, Zhang L, Burow M, et al. Specific recruitment of regulatory T cells in ovarian carcinoma fosters immune privilege and predicts reduced survival. Nat Med. 2004;10:942–949. - PubMed

Publication types

MeSH terms

Associated data