Clinical Trial
. 2013 Oct;134(10):486-95.
doi: 10.1016/j.mad.2013.08.005. Epub 2013 Sep 3.

Epigenetic changes in the progression of Alzheimer's disease

Affiliations
Clinical Trial

Epigenetic changes in the progression of Alzheimer's disease

M A Bradley-Whitman et al. Mech Ageing Dev. 2013 Oct.

Abstract

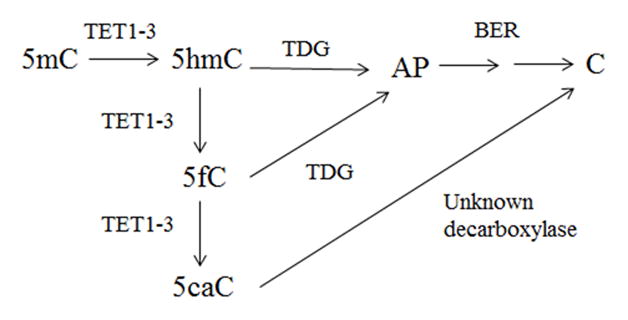
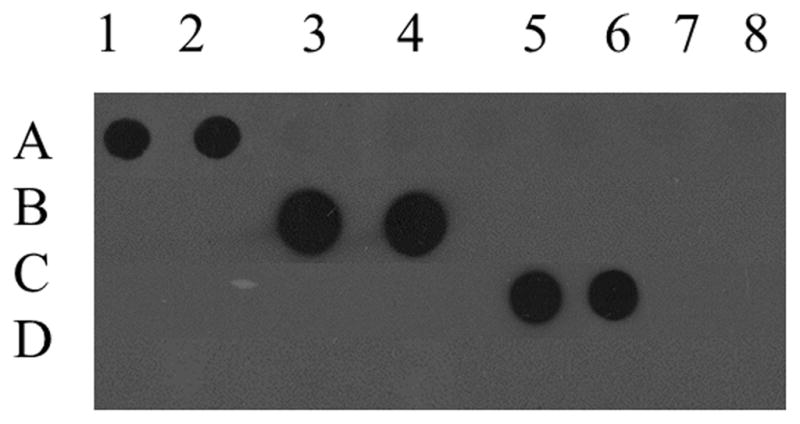
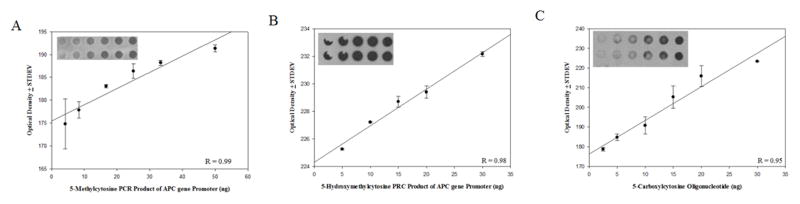
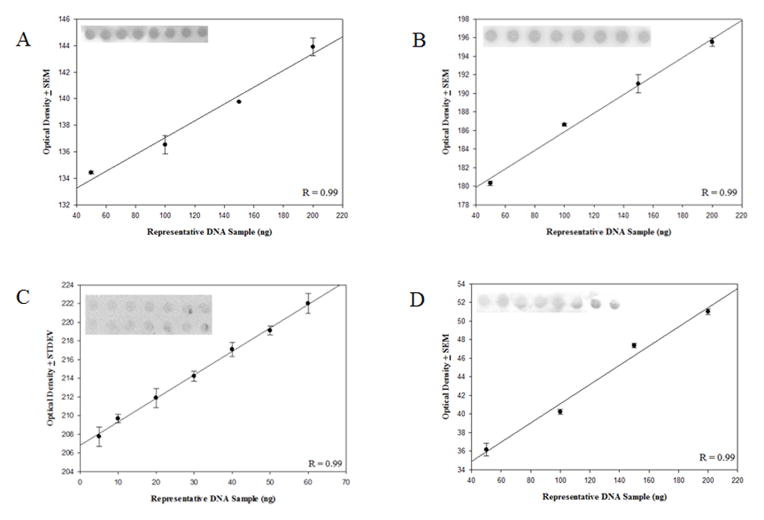
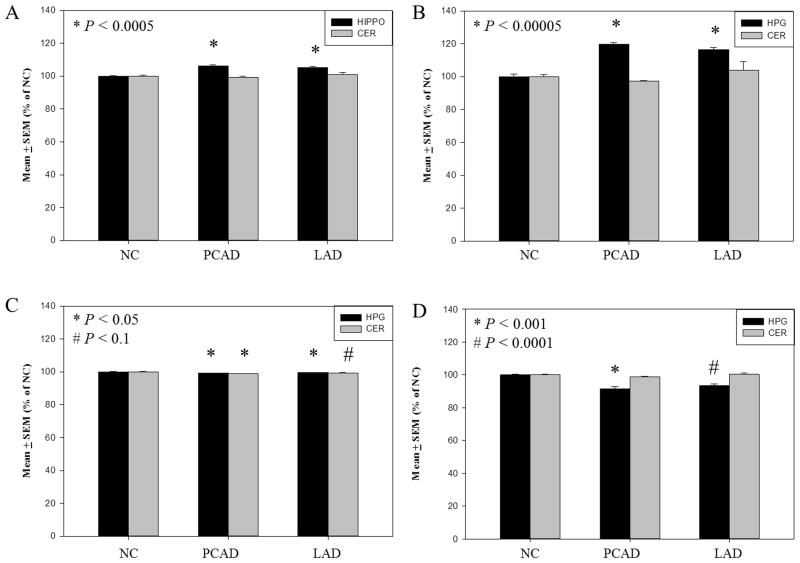
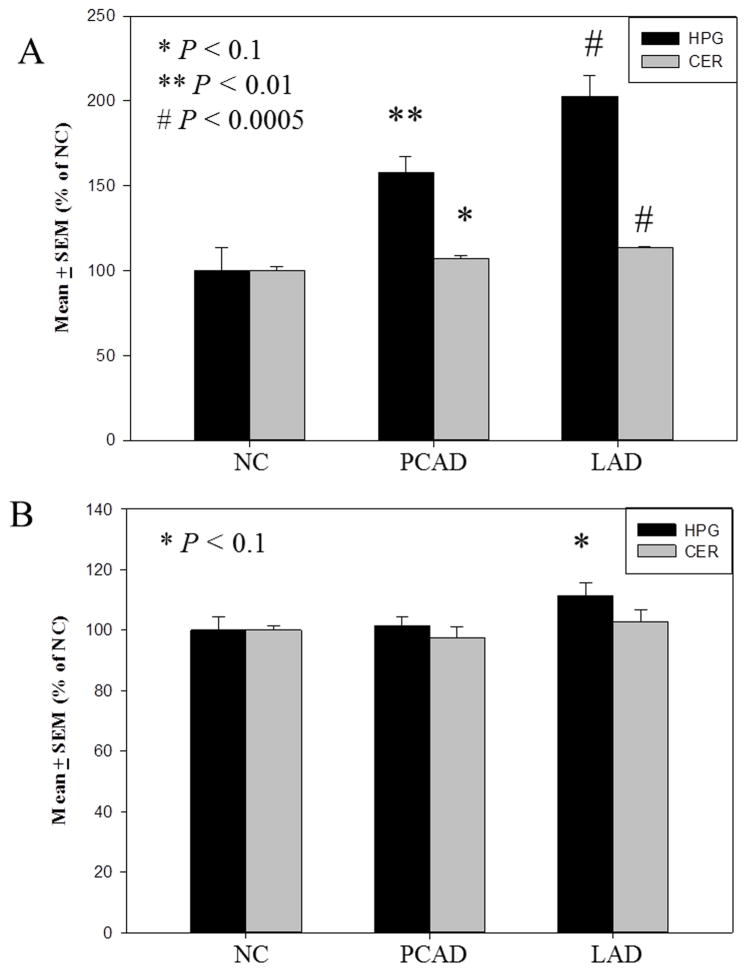
The formation of 5-hydroxymethylcytosine (5hmC), a key intermediate of DNA demethylation, is driven by the ten eleven translocation (TET) family of proteins that oxidize 5-methylcytosine (5mC) to 5hmC. To determine whether methylation/demethylation status is altered during the progression of Alzheimer's disease (AD), levels of TET1, 5mC and subsequent intermediates, including 5hmC, 5-formylcytosine (5fC) and 5-carboxylcytosine (5caC) were quantified in nuclear DNA from the hippocampus/parahippocampal gyrus (HPG) and the cerebellum of 5 age-matched normal controls, 5 subjects with preclinical AD (PCAD) and 7 late-stage AD (LAD) subjects by immunochemistry. The results showed significantly (p < 0.05) increased levels of TET1, 5mC, and 5hmC in the HPG of PCAD and LAD subjects. In contrast, levels of 5fC and 5caC were significantly (p < 0.05) decreased in the HPG of PCAD and LAD subjects. Overall, the data suggest altered methylation/demethylation patterns in vulnerable brain regions prior to the onset of clinical symptoms in AD suggesting a role in the pathogenesis of the disease.

Keywords: 5-Hydroxymethylcytosine; 5-Methylcytosine; Alzheimer's disease; Preclinical Alzheimer's disease.


Figures

Fig. 1
Fig. 1
Potential mechanism for active DNA methylation involving TET-mediated oxidation of 5mC, followed by TDG initiated BER pathway via recognition of 5hmC and 5fC (AP is an abasic site) (adapted from (Maiti and Drohat, 2011)).
Fig. 2
Fig. 2
Specificity of monoclonal antibodies against 5-methylcytosine, 5-hydroxymethylcytosine, 5-forymylcytosine, and 5-carboxylcytosine. The APC gene promoter PCR product amplified with 5-methylcytosine loaded in duplicate in columns 1–2, the APC gene promoter PCR product amplified with 5-hydroxymethylcytosine loaded in duplicate in columns 3–4, a 38 bp oligonucleotide containing 12 5-carboxylcytosine residues loaded in duplicates in columns 5–6, and the APC gene promoter PCR product amplified with cytosine loaded in duplicates in columns 7–8 and incubated with either monoclonal mouse anti-5-methylcytosine (A), monoclonal rabbit anti-5-hydroxymethylcytosine (B), monoclonal rabbit anti-5-formylcytosine (C), and monoclonal rabbit anti-5-carboxylcytosine (D).
Fig. 3
Fig. 3
Evaluation of concentration dependent monoclonal antibody responses. 5-methylcytosine (r = 0.96, p < 0.05) (A), 5-hydroxymethylcytosine (r = 0.98, p < 0.05) (B), and 5-carboxylcytosine (r = 0.95, p < 0.05) (C) showed a significant positive linear response between immunostaining and increasing amounts of DNA standards.
Fig. 4
Fig. 4
Evaluation of concentration dependent monoclonal antibody responses. A representative SMGT nDNA 5-methylcytosine (r = 0.99, p < 0.05) (A), 5-hydroxymethylcytosine (r = 0.99, p < 0.005) (B), 5-forymylcytosine (r = 0.99, p < 0.05) (C), and 5-carboxylcytosine (r = 0.99, p < 0.01) (D) showed a significant positive linear response between immunostaining and increasing amounts of DNA.
Fig. 5
Fig. 5
Purity of nDNA and mtDNA. Representative Western blot analysis of total homogenate (TH; Row 1), nuclear- (NF; Row 2), cytosolic- (CF; Row 3), and mitochondrial-fractions (NF; Row 4) probed for lamin B a nuclear envelope protein (A), MAP2 a microtubular associated protein (B), and Porin a voltage dependent anion channel found on the outer membrane of the mitochondria (C). Representative PCR amplification product of APOE (D) and MT-ND2 (E) of mtDNA (Lane 1) and nDNA (Lane 2) from SMTG and mtDNA (Lane 5) and nDNA (Lane 6) from CER. Representative RNA electropherogram (F).
Fig. 6
Fig. 6
Immunostaining intensity of RNA and DNA pretreated with either DNase-1 free RNase-1 or RNase-I free DNase-I.
Fig. 7
Fig. 7
Levels of 5-hydroxymethylcytosine expressed as mean ± standard error of the mean (SEM) (% nDNA) in normal control (NC) subjects and late-stage Alzheimer’s disease (LAD). Levels of 5-hydroxymethylcytosine were significantly (P < 0.001) lower in the RNA and mitochondrial DNA (mtDNA) compared to the nuclear DNA (nDNA) in the superior and middle temporal gyrus (SMTG) of NC and LAD subjects (A). Levels of 5-hydroxymethylcytosine were significantly (p ≤ 0.05) lower the RNA and mitochondrial DNA (mtDNA) compared to the nuclear DNA (nDNA) in the cerebellum (CER) of NC and LAD subjects (B).
Fig. 8
Fig. 8
Levels of 5-methylcytosine and subsequent derivatives expressed as mean ± standard error of the mean (SEM) (% of normal control [NC]) in the hippocampus/parahippocampal gyrus (HPG) of NC, preclinical Alzheimer’s disease (PCAD), and late-stage Alzheimer’s disease (LAD). Levels of 5-methylcytosine were significantly (p < 0.0005) increased in the HPG of PCAD and LAD subjects compared with NC subjects (A), 5-hydroxymethylcytosine levels were significantly (p < 0.00005) increased in the HPG of PCAD and LAD subjects compared with NC subjects (B), 5–formylcytosine levels were significantly decreased in the HPG of PCAD and LAD subjects compared with NC subjects (C), and 5-carboxylcytosine levels were significantly decreased in (P < 0.001) in the HPG of PCAD and LAD subjects compared with NC subjects (D).
Fig. 9
Fig. 9
Levels of protein expression expressed as mean ± standard error of the mean (SEM) (% of normal control [NC]) in the hippocampus/parahippocampal gyri (HPG) of NC, preclinical Alzheimer’s disease (PCAD), and late-stage Alzheimer’s disease (LAD). Levels of TET1 normalized to lamin-B were significantly (p < 0.01) increased in the HPG of PCAD and LAD subjects compared with NC subjects (A), thymine DNA glycosylase (TDG) normalized to lamin B were trending toward significance (p< 0.1) increased in the HPG of LAD subjects compared with NC subjects (B).

References

    1. Addya K, Wang YL, Leonard DG. Optimization of Apolipoprotein E Genotyping. Mol Diagn. 1997;2:271–276. - PubMed
    1. Aluise CD, Robinson RA, Beckett TL, Murphy MP, Cai J, Pierce WM, Markesbery WR, Butterfield DA. Preclinical Alzheimer disease: brain oxidative stress, Abeta peptide and proteomics. Neurobiol Dis. 2010;39:221–8. - PMC - PubMed
    1. Bakulski KM, Dolinoy DC, Sartor MA, Paulson HL, Konen JR, Lieberman AP, Albin RL, Hu H, Rozek LS. Genome-wide DNA methylation differences between late-onset Alzheimer’s disease and cognitively normal controls in human frontal cortex. J Alzheimers Dis. 2012;29:571–88. - PMC - PubMed
    1. Bhutani N, Brady JJ, Damian M, Sacco A, Corbel SY, Blau HM. Reprogramming towards pluripotency requires AID-dependent DNA demethylation. Nature. 2010;463:1042–7. - PMC - PubMed
    1. Bird A. DNA methylation patterns and epigenetic memory. Genes Dev. 2002;16:6–21. - PubMed

Publication types

Substances