. 2013 Sep 12;4(5):945-58.
doi: 10.1016/j.celrep.2013.08.002. Epub 2013 Sep 5.

NLRP3 inflammasome blockade inhibits VEGF-A-induced age-related macular degeneration

Affiliations

NLRP3 inflammasome blockade inhibits VEGF-A-induced age-related macular degeneration

Alexander G Marneros. Cell Rep. .

Abstract

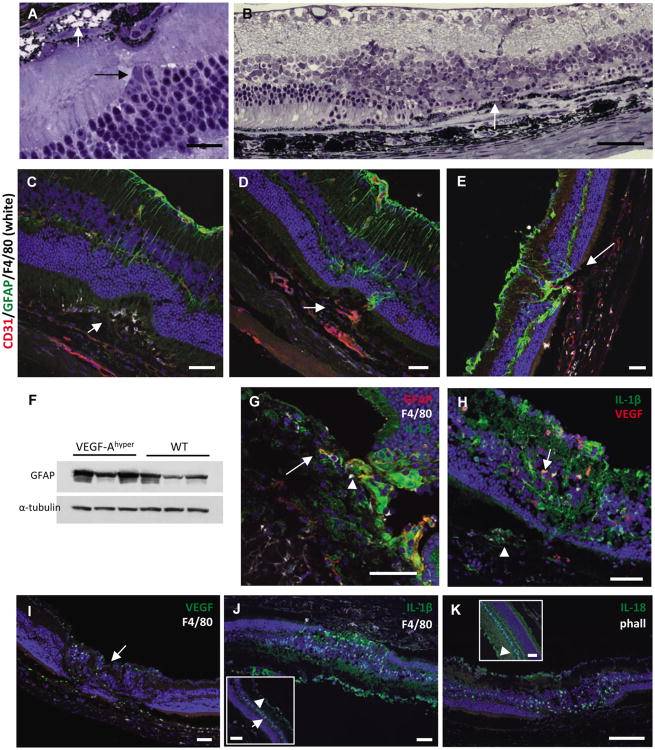
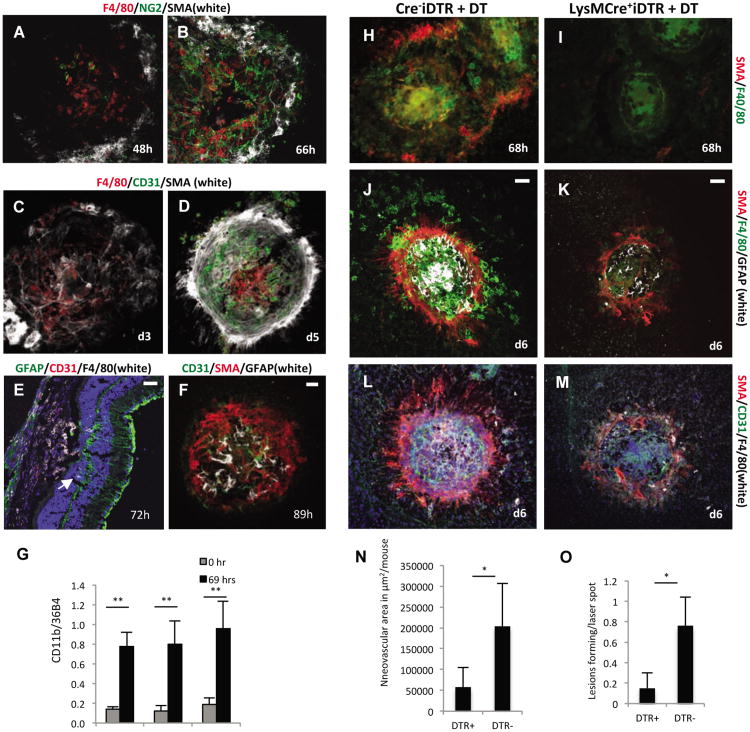
The NLRP3 inflammasome is activated in age-related macular degeneration (AMD), but it remains unknown whether its activation contributes to AMD pathologies. VEGF-A is increased in neovascular ("wet") AMD, but it is not known whether it plays a role in inflammasome activation, whether an increase of VEGF-A by itself is sufficient to cause neovascular AMD and whether it can contribute to nonexudative ("dry") AMD that often co-occurs with the neovascular form. Here, it is shown that an increase in VEGF-A results in NLRP3 inflammasome activation and is sufficient to cause both forms of AMD pathologies. Targeting NLRP3 or the inflammasome effector cytokine IL-1β inhibits but does not prevent VEGF-A-induced AMD pathologies, whereas targeting IL-18 promotes AMD. Thus, increased VEGF-A provides a unifying pathomechanism for both forms of AMD; combining therapeutic inhibition of both VEGF-A and IL-1β or the NLRP3 inflammasome is therefore likely to suppress both forms of AMD.


Conflict of interest statement

No conflict of interest is reported.

Figures

Figure 1
Figure 1. Increased VEGF-A levels result in a progressive RPE barrier breakdown
a. The RPE is the main cell type of VEGF-A expression in the adult eye. Immunolabeling of an adultposterior eye of a VEGF-Ahyper mouse (15 months old) for β-galactosidase reflects cellular expressionof VEGF-A (green). Strong VEGF-A expression is observed in RPE cells (arrow), whereas low-levelVEGF-A expression is seen in retinal cells of the ganglion cell layer (GCL) and inner nuclear layer(INL) (arrowheads), but not the photoreceptor layer (outer nuclear layer; ONL). Scale bar 50μm. b. VEGF-A ELISA of RPE/choroid and retinal tissue in adult VEGF-Ahyper mice (KI) and controllittermate (WT) mice (n=7/group) shows a significant increase of VEGF-A levels in the RPE/choroidtissues in VEGF-Ahyper mice. Serum levels of VEGF-A are elevated in mutant mice independently ofage as well (n=3/group). *P-value <0.05. c. Mouse and human RPE cells express the VEGF-A receptors Flt1 and Flk1 and all major VEGF-Aisoforms, particularly VEGF-A164 and VEGF-A121 (VEGF-A165 and VEGF-A121 in human). d. Focal RPE barrier breakdown is observed in VEGF-Ahyper mice with cytoplasmic and nuclearaccumulation of β-catenin. Co-labeling with Alexa488-conjugated phalloidin (green) shows that innormal RPE cells phalloidin and β-catenin (red) labeling is strongest along cell membranes, while inRPE cells with RPE barrier breakdown β-catenin labeling along the cell membranes is attenuatedand increased in the nuclei or cytoplasm. 7 months old VEGF-Ahyper mouse. Scale bar 20μm. e. Co-labeling of cell junction proteins β-catenin (red) and ZO-1 (green) shows loss of membrane-bound ZO-1 and β-catenin with nuclear accumulation. 7 months old VEGF-Ahyper mouse. Scale bar50μm. f. FITC-dextran flux assays with RPE cells demonstrate that VEGF-A165 treatment induces barrierbreakdown and increased transepithelial flux of 10kDa FITC-dextran. (n=3), *P-value <0.05. y-axisindicates fluorescence units (AU). g.-h. Choroidal flatmount staining of eyes from VEGF-Ahyper mice with β-catenin (red) shows that RPE-barrier breakdown is observed in small foci (arrow) in young VEGF-Ahyper eyes (2 months old, (g)), but that these areas expand and become confluent and affect most of the posterior eye (arrows) with progressive age of the mice (12 months old, (h)). Scale bars 200μm. i. Magnification of area from Figure 1H that delineates normal appearing RPE with its honeycomb pattern from lesional abnormal appearing RPE cells. Scale bar 200μm. j. Adult VEGF-Ahypo mice, hypomorphic for VEGF-A, express β-galactosidase (green) from the endogenous VEGF-A gene locus, but show normal RPE cells. Scale bar 100μm. k. In contrast, adult VEGF-Ahyper mice, with increased VEGF-A levels, show the same expression of β-galactosidase (green) from the endogenous VEGF-A gene locus as VEGF-Ahypo mice, but show multifocal RPE barrier breakdown. Scale bar 100μm. l. Mice that express VMD2-Cre specifically in RPE cells (white nuclear staining for Cre) that are heterozygous for VEGF-Afl/fl and carry the VEGF-Ahyper allele; in these mice Cre+ RPE cells are expected to have lower levels of VEGF-A than Cre- RPE cells. RPE barrier breakdown occurs predominantly within Cre- RPE-patches (therefore expressing higher levels of VEGF-A). Scale bar 100μm. See also Figure S1.
Figure 2
Figure 2. Progressive age-dependent degeneration of the RPE and photoreceptors in mice with increased VEGF-A levels
a.-d. While the retina and choroid/RPE appear unremarkable in young adult VEGF-Ahyper mice (6 weeks old, b), with progressive age a severe RPE atrophy is noticed with loss of pigment granules, thinning of RPE cells and massive sub-RPE deposit accumulation (black arrow, d). The photoreceptor nuclear layer (ONL) is severely attenuated (white double arrow, d) compared to age-matched littermate control retinas (c). In addition, photoreceptor inner and outer segments (black double arrow) are significantly shortened (d). Scale bar 20μm. * indicates Bruch's membrane. e. Quantification of RPE and photoreceptor length reveals significantly thinned RPE and attenuatedphotoreceptor outer (OS), inner (IS) segments and ONL in aged mutant mice (20 months of age). *P-value <0.05. f. Photoreceptor degeneration is reflected in reduced rhodopsin protein levels in posterior eyes ofaged VEGF-Ahyper mice (KI, 12 and 17 months old) compared to control littermate mice (WT). Normalized densitometric values are indicated. g.-h. Electron microscopy demonstrates massive accumulation of basal laminar sub-RPE deposits in aged (20 months old, h) VEGF-Ahyper mice compared to age-matched control littermate mice (g). The RPE is thinned in VEGF-Ahyper mice (black double arrow) and sub-RPE deposits (white double arrow) consist of electron-dense deposits resembling basal laminar deposits and electron-lucent spaces indicate lipid-like material that was removed during fixation(black arrows). BrM: Bruch's membrane. OS: photoreceptor outer segments. Scale bars 500nm. i. Oil red O staining in an aged VEGF-Ahyper mouse shows accumulation of lipid droplets in sub-RPE deposits (white arrow). Black arrowhead points to Bruch's membrane (BrM). CL: Choroidal layer. Scale bar 10μm. j. RPE cell degeneration in aged VEGF-Ahyper mice (15 months old) with RPE cells focally undergoing cell death, demonstrated by cleaved caspase 3 (Asp175) immunostaining (white arrows). CL: choroid layer Scale bar 50μm. See also Figure S2.
Figure 3
Figure 3. Choroidal neovascularization and NLRP3 expression in aged VEGF-Ahypermice
a.-b. Perfusion experiments in aged white VEGF-Ahyper mice with fluorescein-conjugated tomato lectin and subsequent wholemount staining for CD31 and phalloidin shows that proliferating neovessels (CD31, red) originate from the underlying perfused choroidal vasculature (green) and extend into the sub-RPE space. Autofluorescent round deposits can be seen at sites of CNV lesions. Scale bars 50μm. Inset in b. represents modeled z-stack of lesion. c. Representative section of CNV lesion in aged VEGF-Ahyper mice shows massive subretinalneovascularization (arrow). Scale bar 20μm. d. Representative image of a fully formed CNV lesion in a 7 months old VEGF-Ahyper mouse thatresembles a neovascular membrane in neovascular AMD (arrow). Neovascularization and fibrosishave completely replaced the photoreceptor layer at the site of CNV formation. Scale bar 50μm. e. In age-matched control littermate mice such lesions were not seen. Scale bar 50μm. f. Co-localization of RPE barrier breakdown with CNV lesions. Choroidal flatmount of a 24 monthsold white VEGF-Ahyper mouse in which choroidal perfusion is assessed by intracardiac administrationof a fluorescein-conjugated tomato lectin (green). Subsequent whole-mount staining for CD31 (red)highlights proliferating neovessels from underlying perfused choroidal vessels (green), and labelingfor β-catenin (white) shows RPE barrier breakdown at sites of neovascularization with cytoplasmicaccumulation of β-catenin. Scale bar 50μm. g. Strongly increased NLRP3 expression in RPE cells in CNV lesions (arrows) with attenuation or lossof the overlying photoreceptor layer. 15 months old VEGF-Ahyper mice. Scale bars 50μm. h. Perivascular accumulation of C1qA within CNV lesions (arrow). 15 months old VEGF-Ahyper mice. Scale bar 50μm. i. Western blotting demonstrates accumulation of C1qA in choroid/RPE tissues of aged VEGF-Ahyper mice, while control littermate mice showed no accumulation of C1qA. Choroid/RPE or retinal tissues represent pools from three 25 months old VEGF-Ahyper mice or control mice. Normalized relative densitometric values are indicated. j. Acrolein, a marker for ROS-induced lipid peroxidation, is increased focally in abnormal RPE cells in aged VEGF-Ahyper mice (green, arrow) (15 months old). DAPI nuclear staining; photoreceptor outer segments show autofluorescence (green). Scale bar 50μm. k. VEGF-A165 treatment of ARPE-19 cells loaded with 10 μM dihydroethidium (DHE) induces increased oxidative stress (superoxide indicator), measured by FACS (PerCP-Cy5-5 channel). Y-axis shows mean fluorescence intensity (MFI) of triplicate experiments (n=3/group). A representative histogram demonstrates the shift of fluorescence induced by VEGF-A165, representing increased superoxide species. *P-value <0.05. l. VEGF-A serum levels are increased in young (7 weeks old) SOD1-/- mice, compared to age- and gender-matched control littermate mice (n=5). *P-value <0.05. m. SOD1 is efficiently depleted using SOD1-targeted siRNA, demonstrated by Western blotting of ARPE-19 cell lysate. Cell culture supernatant of cells, primed with 4ng/ml IL-1α, shows that SOD1 knockdown increases levels of the inflammasome effector cytokine IL-1β in both ARPE-19 cells and the B-3 lens epithelial cells. N=4/group. *P-value <0.05. See also Figure S3.
Figure 4
Figure 4. Blockade of the NLRP3 inflammasome reduces CNV lesions in VEGF-Ahypermice
a. Left: Western blotting of posterior eye lysates from 12 and 17 months old VEGF-Ahyper mice (KI)and control littermate mice (WT) shows activation of the inflammasome with strong upregulation ofthe caspase-1 active subunit p20 in mutant mice. Right: Pools of RPE/choroid or retinal tissue fromthree 25 months old VEGF-Ahyper mice (KI) and control littermate mice (WT) show strongupregulation of the p10 caspase-1 active subunit in the RPE/choroid, but not in the retina,demonstrating inflammasome activation in RPE/choroid tissues of VEGF-Ahyper mice. Normalizeddensitometric values are indicated. b. NLRP3 (green, arrows) is strongly expressed in RPE cells in VEGF-Ahyper mice (15 months old). Macrophages are stained with F4/80 (white). Co-labeling for the activated p10 subunit of caspase-1(red) with NLRP3 (green) shows inflammsome activation. Scale bar 50μm. c. NLRP3 immunostaining of choroidal flatmounts with expression of NLRP3 in RPE cells that showabnormal cellular morphology (phalloidin, white; arrow), while normal appearing RPE cells withtypical honeycomb cytoarchitecture do not express NLRP3 (red). (13 months old). No NLRP3expression is seen in F4/80+ macrophages (green, arrowhead). Scale bar 50μm. d.-g. Round autofluorescent extracellular deposits accumulate at sites of RPE degeneration in aged VEGF-Ahyper mice (21 months old). These round deposits are phalloidin-negative (e), and show autofluorescence with UV-light (f), or the green light channel (g), which also shows increased NLRP3 immunostaining at sites of these deposits. Scale bar 50μm. h. RPE barrier breakdown (β-catenin, red), macrophage infiltration (F4/80, white) and CNV lesion formation (CD31, green) occurs in VEGF-Ahyper mice, despite genetic inactivation of IL-1R1, NLRP3 or IL-18. Representative images of choroidal flatmounts from 6 week old mice. Scale bars 100μm. i. Quantitative analysis of CNV lesion numbers per age-matched mutant mice (6 weeks old) in choroidal flatmounts (average CNV lesion numbers/mouse of choroidal flatmounts stained for β-catenin and CD31). No CNV lesions were seen in WT control mice. P-values were determined with a two-tailed Student's t-test. N>7 mice/group. See also Figure S4.
Figure 5
Figure 5. Glia cell activation in CNV lesions in VEGF-Ahypermice
a. In young VEGF-Ahyper mice (6 weeks old) early RPE degeneration is seen only focally with someRPE cells undergoing vacuolar degeneration (intracellular vacuoles with remaining pigmentgranules; black arrow). At this stage retinal changes are limited, but migration of retinal Muller gliacells (white arrow) towards sites of RPE degeneration can already be observed. Scale bar 20μm. b. In aged VEGF-Ahyper mice the photoreceptor layer adjacent to CNV lesions is present, butattenuated. Complete loss of photoreceptors is seen in retina overlying CNV lesions with anaccumulation of retinal Muller glia cells (arrow). Scale bar 50μm. 21 months old VEGF-Ahyper mouse. c. At sites of early evolving CNV lesions subretinal macrophages (F4/80+, white; arrow) are seenprior to neovessel formation. Limited to the overlying retina GFAP expression (green) increases,indicating glia cell activation and proliferation, while adjacent retina appears unchanged. Scale bar50μm. 4 months old VEGF-Ahyper mouse. d. In early CNV lesions with subretinal neovascularization (CD31, red; arrow) GFAP+ glia cells have increased and have infiltrated early CNV lesions (green). Scale bar 50μm. 4 months old VEGF-Ahyper mouse. e. In aged VEGF-Ahyper mice with large CNV lesions, massive GFAP expression and glia cell infiltration into sites of CNV lesion formation is seen (arrow). Scale bar 50μm. 15 months old VEGF-Ahyper mouse. f. Retinal GFAP is increased in aged VEGF-Ahyper mice compared to littermate control mice. 16 months old mice. g. Co-immunolabeling for GFAP (red), IL-1β (green) and F4/80 (white), shows that high IL-1β expression is seen in infiltrating retinal glia cells (arrowhead), while lower levels are observed in RPE cells and only in few macrophages in CNV lesions (arrow). No IL-1β is detected in most choroidal macrophages. Scale bar 50μm. 15 months old VEGF-Ahyper mouse. h. Retinal glia cells co-express both VEGF-A and IL-1β in the retina overlying CNV lesions where the photoreceptor layer is severely attenuated (arrow). Labeling for IL-1β and VEGF-A is also seen in RPE cells (arrowhead) in CNV lesions. Scale bar 50μm. 15 months old VEGF-Ahyper mouse. i. Increased VEGF-A expression (green) is seen in retinal glia cells overlying CNV lesions (arrow). Scale bar 50μm. 15 months old VEGF-Ahyper mouse. j. While IL-1β is expressed in glia cells overlying CNV lesions that have replaced the ONL, adjacent normal appearing retina (inset) shows only weak IL-1β expression in the INL (arrow) and GCL (arrowhead). Scale bars 50μm. 15 months old VEGF-Ahyper mouse. k. Infiltrating retinal glia cells show strong expression of IL-18 overlying CNV lesions. Scale bar 50μm. 15 months old VEGF-Ahyper mouse. See also Figure S5.
Figure 6
Figure 6. Macrophages are required for retinal glia cell activation and subsequent neovascularization
a.-b. A fibroblast-like scaffold forms after macrophage (red) infiltration that is positive for NG2 (green) and SMA (white). 10× magnification. c. The fibroblast-like scaffold forms prior to infiltration of the laser-injury site with endothelial cells,as the first CD31+ endothelial cells are seen at about 68 hours after injury, when the NG2+SMA+scaffold has already formed. 10× magnification. d. Neovascularization occurs after macrophage infiltration and after the formation of the SMA+scaffold and fully formed CNV lesions are seen at day 5 (CD31, green). The SMA+ scaffold covers theneovascular lesions, resembling a scar after wound injury. 10× magnification. Control mice. e. GFAP+ retinal glia cells (arrow) infiltrate the laser injury site already by 72 hours, beforeendothelial cells have populated the site. Scale bar 50μm. f. At day 4 after laser injury new blood vessels form at the site of laser injury after GFAP+ cells havealready infiltrated the SMA+ scaffold. Scale bar 50μm. a.-f. Control mice. g. Semiquantitative RT-PCR of choroidal tissue lysates shows an increase of macrophages at 69hours after laser injury (CD68 levels normalized to 36B4 house-keeping gene), consistent with theimmunolabeling results. Macrophage accumulation occurs independently of IL10 or STAT6signaling. N=5/group. **P-value <0.01. h.-i. Homozygous LysMCre+iDTR mice were used for DT injections to temporally and selectively ablate myeloid cells in laser-injury experiments and compared to Cre-iDTR mice. DT treatment potently diminished F4/80+ macrophage infiltration into the laser-injury site, assessed here at 68 hours after injury. Ablation of macrophages also inhibited the SMA+ scaffold formation (i). j.-k. Ablation of macrophages inhibited GFAP+ glia cell activation (white) and infiltration into the site of laser injury. l.-m. Inhibition of macrophage infiltration and glia cell activation resulted in a significant inhibition of neovascularization. Only few CD31+ vessels (green) were seen at laser-injury sites in which macrophage accumulation was reduced, while full neovascular lesions formed in mice with no ablation of macrophages. Scale bars 50μm. n.-o. Reduced CNV lesion formation was seen in mice with selective ablation of macrophages, with a reduction in the total neovascular area and the rate of CNV lesion formation for each laser injury administered. N=20 mice/group. *P-value <0.05. See also Figure S6.

References

    1. Ablonczy Z, Dahrouj M, Tang PH, Liu Y, Sambamurti K, Marmorstein AD, Crosson CE. Human retinal pigment epithelium cells as functional models for the RPE in vivo. Invest Ophthalmol Vis Sci. 2011;52:8614–8620. - PMC - PubMed
    1. Anderson DH, Mullins RF, Hageman GS, Johnson LV. A role for local inflammation in the formation of drusen in the aging eye. American journal of ophthalmology. 2002;134:411–431. - PubMed
    1. Bird AC, Bressler NM, Bressler SB, Chisholm IH, Coscas G, Davis MD, de Jong PT, Klaver CC, Klein BE, Klein R, et al. An international classification and grading system for age-related maculopathy and age-related macular degeneration. The International ARM Epidemiological Study Group. Surv Ophthalmol. 1995;39:367–374. - PubMed
    1. Brydges SD, Mueller JL, McGeough MD, Pena CA, Misaghi A, Gandhi C, Putnam CD, Boyle DL, Firestein GS, Horner AA, et al. Inflammasome-mediated disease animal models reveal roles for innate but not adaptive immunity. Immunity. 2009;30:875–887. - PMC - PubMed
    1. Cao X, Shen D, Patel MM, Tuo J, Johnson TM, Olsen TW, Chan CC. Macrophage polarization in the maculae of age-related macular degeneration: a pilot study. Pathol Int. 2011;61:528–535. - PMC - PubMed

Publication types

MeSH terms

Substances