. 2013 Dec;145(6):1424-35.e1-25.
doi: 10.1053/j.gastro.2013.08.055. Epub 2013 Sep 5.

Genome-wide methylation analysis and epigenetic unmasking identify tumor suppressor genes in hepatocellular carcinoma

Affiliations

Genome-wide methylation analysis and epigenetic unmasking identify tumor suppressor genes in hepatocellular carcinoma

Kate Revill et al. Gastroenterology. 2013 Dec.

Abstract

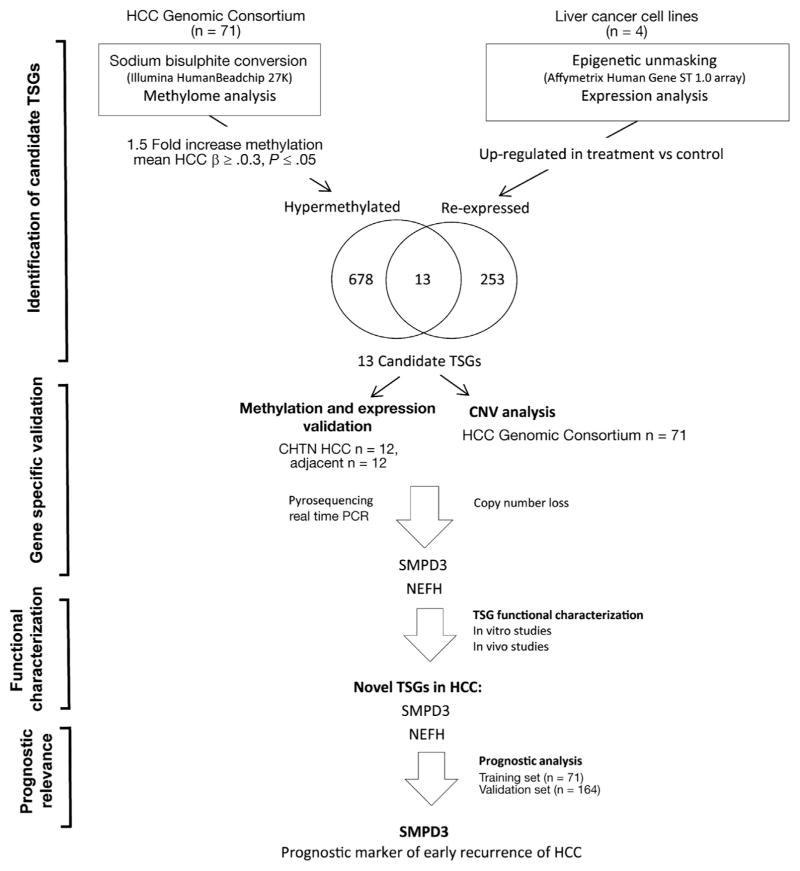
Background & aims: Epigenetic silencing of tumor suppressor genes contributes to the pathogenesis of hepatocellular carcinoma (HCC). To identify clinically relevant tumor suppressor genes silenced by DNA methylation in HCC, we integrated DNA methylation data from human primary HCC samples with data on up-regulation of gene expression after epigenetic unmasking.

Methods: We performed genome-wide methylation analysis of 71 human HCC samples using the Illumina HumanBeadchip27K array; data were combined with those from microarray analysis of gene re-expression in 4 liver cancer cell lines after their exposure to reagents that reverse DNA methylation (epigenetic unmasking).

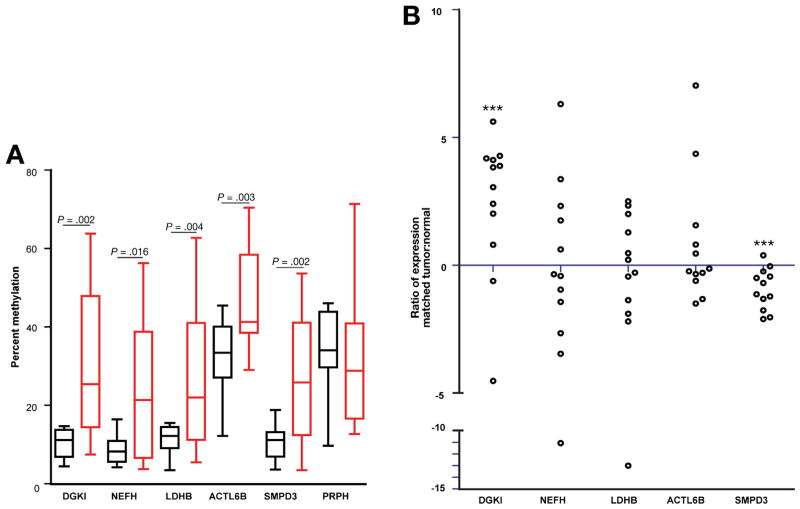
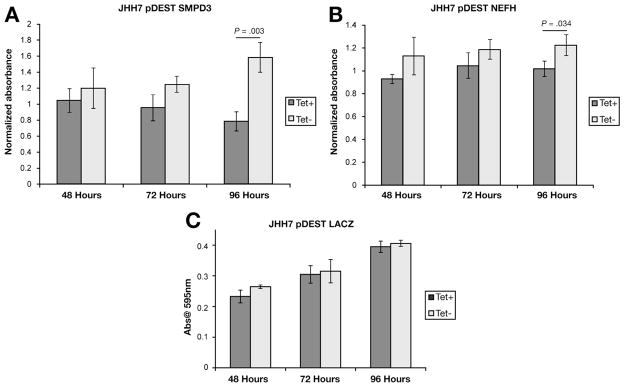
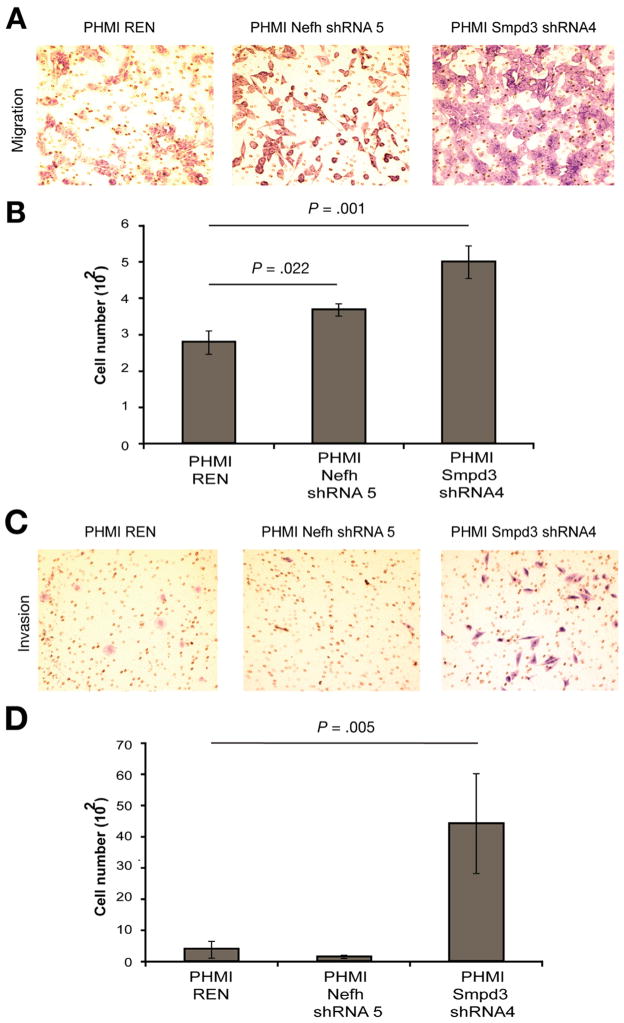
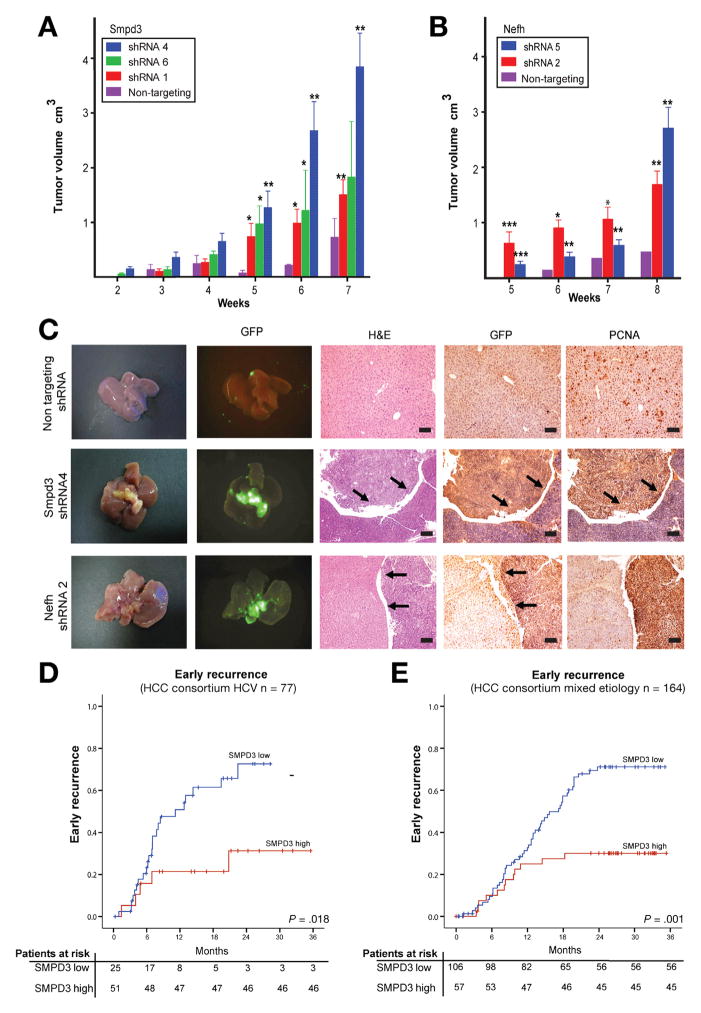
Results: Based on DNA methylation in primary HCC and gene re-expression in cell lines after epigenetic unmasking, we identified 13 candidate tumor suppressor genes. Subsequent validation led us to focus on functionally characterizing 2 candidates, sphingomyelin phosphodiesterase 3 (SMPD3) and neurofilament, heavy polypeptide (NEFH), which we found to behave as tumor suppressor genes in HCC. Overexpression of SMPD3 and NEFH by stable transfection of inducible constructs into an HCC cell line reduced cell proliferation by 50% and 20%, respectively (SMPD3, P = .003 and NEFH, P = .003). Conversely, knocking down expression of these genes with small hairpin RNA promoted cell invasion and migration in vitro (SMPD3, P = .0001 and NEFH, P = .022), and increased their ability to form tumors after subcutaneous injection or orthotopic transplantation into mice, confirming their role as tumor suppressor genes in HCC. Low levels of SMPD3 were associated with early recurrence of HCC after curative surgery in an independent patient cohort (P = .001; hazard ratio = 3.22; 95% confidence interval: 1.6-6.5 in multivariate analysis).

Conclusions: Integrative genomic analysis identified SMPD3 and NEFH as tumor suppressor genes in HCC. We provide evidence that SMPD3 is a potent tumor suppressor gene that could affect tumor aggressiveness; a reduced level of SMPD3 is an independent prognostic factor for early recurrence of HCC.

Keywords: 5-aza-2-deoxycitidine; 5-aza-2′deoxycitidine; ACTL6B; CHTN; CpG; DAC; DGKI; ELOVL fatty acid elongase 4; ELOVL4; GSTP1; HCC; LDHB; LRAT; ND; NEFH; PRPH; SMPD3; Sphingomyelin Phosphodiesterase; TSA; actin-like 6B; cooperative tissue network; cytosine preceding guanine; diacylglycerol kinase, iota; glutathione S-transferase 1; hepatocellular carcinoma; lactate dehydrogenase B; lecithin retinol acyltransferase (phosphatidylcholine−retinol O-acyltransferase); nSMase2; neurofilament, heavy polypeptide; nondiseased; peripherin; shRNA; short hairpin RNA; sphingomyelin phosphodiesterase 3; trichostatin A.


Conflict of interest statement

Conflicts of interest

The authors disclose no conflicts.

Figures

Figure 1
Figure 1
Study overview. Seventy-one patients from the HCC Genomic Consortium were profiled for methylation status and 4 liver cancer cell lines analyzed for gene re-expression after epigenetic unmasking to identify candidate tumor suppressor genes (TSGs). Candidates were validated for methylation and gene expression in 12 paired HCC samples from CHTN and copy number variation (CNV) in the HCC Genomic Consortium. Functional validation was performed in vitro and in vivo for the strongest candidates and prognostic implications explored.
Figure 2
Figure 2
Candidate gene methylation validation. (A) Methylation-specific pyrosequencing analysis of 6 candidate genes–SMPD3, NEFH, DGKI, LDHB, PRPH, ACTL6B–in 12 paired normal HCC samples. Normal tissue is indicated by a black box and whisker, tumor tissue is indicated by a red box and whisker. Values are displayed as the percentage of methylation at each CpG site. (B) Transcript expression analysis of 12 primary HCC samples relative to matched normal for SMPD3, NEFH, DGKI, and ACTL6B exhibiting hypermethylation in tumor vs normal by pyrosequencing analysis. Data from quantified quantitative real-time polymerase chain reaction values were normalized to matched normal tissue and log-2 transformed (± SD, *P ≤ .05, **P ≤.01, ***P ≤.001).
Figure 3
Figure 3
Overexpression of SMPD3 and NEFH significantly reduces cell proliferation. JHH-7 pDEST SMPD3 (A), JHH-7 pDEST NEFH (B), and JHH-7 pDEST β-galactosidase (LACZ), and (C) human hepatocellular carcinoma cells were induced to express their respective transgenes with 5 μg/mL of tetracycline. Cell viability was measured using a 3-(4,5-dimethylthiazol-2-yl)-2,5-diphenyltetrazolium bromide assay at 48, 72, and 96 hours post induction. Assays were performed in triplicate. Cell viability measurements of JHH7 pDEST SMPD3 and JHH7 pDEST NEFH were normalized by those obtained for the control cells JHH7 pDEST LACZ.
Figure 4
Figure 4
Depletion of SMPD3 and NEFH significantly increases cell migration and/or invasion. (A) Effect on cell migration of tumor protein p53 (p53)−/−; Myc mouse hepatoblasts (PHMI cells) with shRNA directed to either Nefh or Smpd3. Panels are, from left to right: migration of cells with nontargeting knockdown (REN shRNA), migration of cells with knockdown of Nefh, and migration of cells with knockdown of Smpd3. (B) Quantification of cell migration for each cell line. Cell number is averaged over 5 fields of view. (C) Effect on cell invasion of p53−/−; Myc mouse hepatoblasts (PHMI cells) with shRNA directed to either Nefh or Smpd3. Panels are, from left to right: invasion of cells with non-targeting knockdown, invasion of cells with knockdown of Nefh, and invasion of cells with knockdown of Smpd3. (D) Quantification of cell invasion for each cell line. Cell number is averaged over 5 fields of view.
Figure 5
Figure 5
Depletion of Smpd3 and Nefh promotes liver carcinoma formation. (A) Subcutaneous growth of tumor protein p53 (p53)−/−; Myc hepatoblasts infected with either nontargeting shRNA, shRNA 4, shRNA 6, or shRNA 1 to Smpd3 (n = 6 injections, asterisks indicate that the indicated tumor group is significantly different than controls, error bars denote ±SD, *P < .05; **P < .01; ***P < .001). Tumor volumes were determined from 2 to 7 weeks post injection. (B) Subcutaneous growth of p53−/−; Myc hepatoblasts infected with either nontargeting shRNA or shRNA2 or shRNA 5 to Nefh (n = 6 injections, asterisks indicate that the indicated tumor group is significantly different than controls, error bars denote ±SD, *P < .05; **P < .01; ***P < .001). Tumor volumes were determined from 5 to 8 weeks post injection. (C) Images of mouse livers and sections taken 6 weeks after transplantation of p53−/−; Myc mouse hepatoblasts with knockdown of either Smpd3 or Nefh. Panel columns are, from left to right: intact livers; fluorescent imaging of intact liver for green fluorescent protein (GFP)–positive transplanted cells; H&E staining of liver tissue sections showing the border between normal liver and carcinoma (arrows); immunohistochemical detection of GFP; and immunohistochemical detection of proliferating cell nuclear antigen (PCNA). The last 3 are from the same tissue block. Scale bars = 100 μm. (D) Association of SMPD3 expression with time to early and late recurrence after surgery early recurrence in patients from HCC Genomic Consortium. SMPD3 high-expressing patients are indicated in blue and SMPD3 low-expressing patients are indicated in red. (E) Early recurrence in patients from validation cohort. SMPD3 high-expressing patients are indicated in blue and SMPD3 low-expressing patients are indicated in red.

Similar articles

Cited by

References

    1. Altekruse SF, McGlynn KA, Reichman ME. Hepatocellular carcinoma incidence, mortality, and survival trends in the United States from 1975 to 2005. J Clin Oncol. 2009;27:1485–1491. - PMC - PubMed
    1. Ferlay J, Shin HR, Bray F, et al. Estimates of worldwide burden of cancer in 2008: GLOBOCAN 2008. Int J Cancer. 2010;127:2893–2917. - PubMed
    1. Llovet JM, Ricci S, Mazzaferro V, et al. Sorafenib in advanced hepatocellular carcinoma. N Engl J Med. 2008;359:378–390. - PubMed
    1. Villanueva A, Hernandez-Gea V, Llovet JM. Medical therapies for hepatocellular carcinoma: a critical view of the evidence. Nat Rev Gastroenterol Hepatol. 2013;10:34–42. - PubMed
    1. Calvisi DF, Ladu S, Gorden A, et al. Mechanistic and prognostic significance of aberrant methylation in the molecular pathogenesis of human hepatocellular carcinoma. J Clin Invest. 2007;117:2713–2722. - PMC - PubMed

Publication types

MeSH terms

Associated data