. 2014 Mar 15;66(2):222-9.
doi: 10.1016/j.ymeth.2013.08.027. Epub 2013 Sep 4.

Metabolic imaging in multiple time scales

Affiliations

Metabolic imaging in multiple time scales

V Krishnan Ramanujan. Methods. .

Abstract

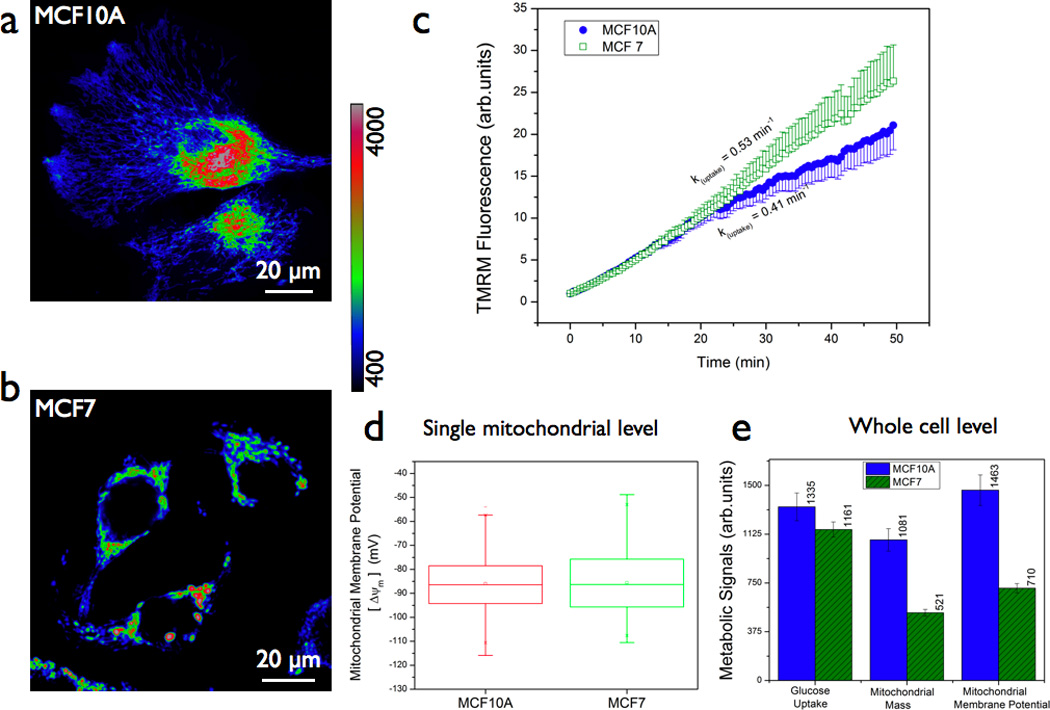
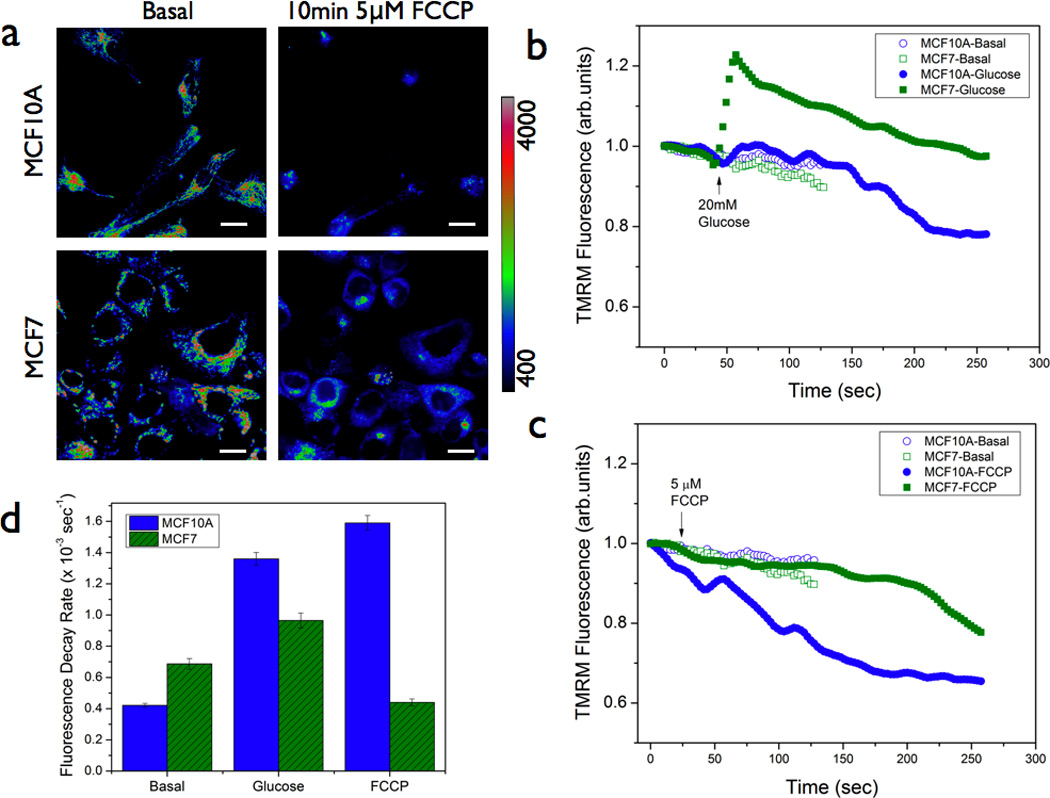
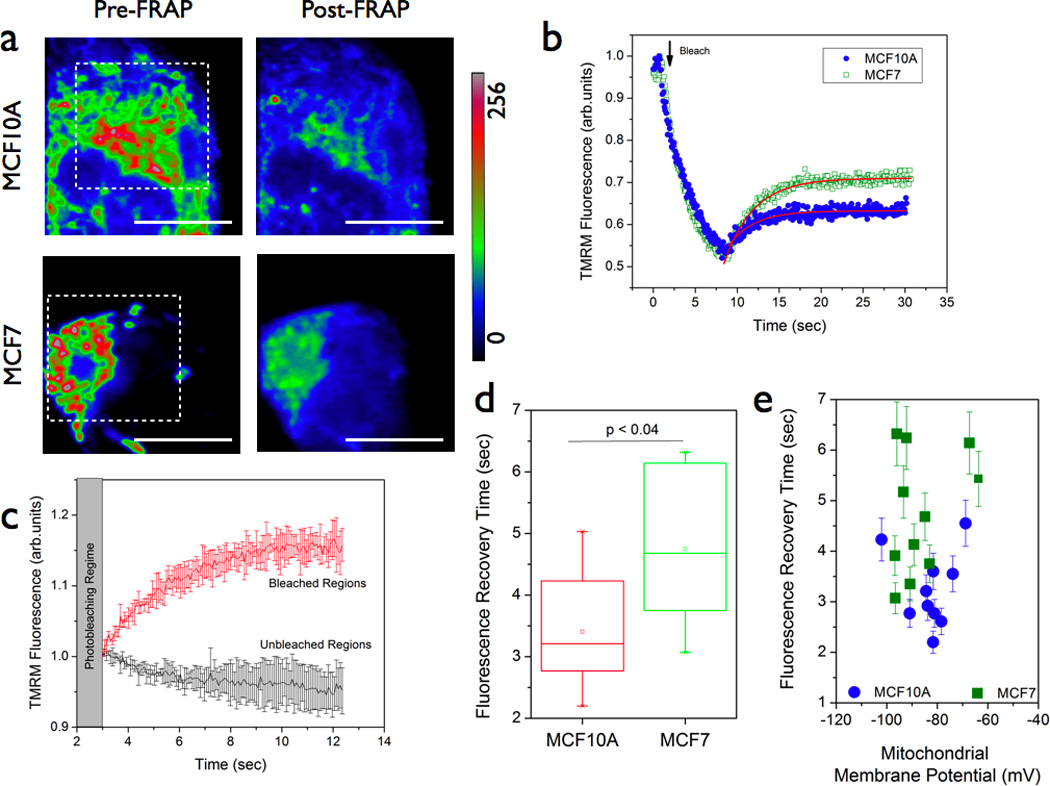
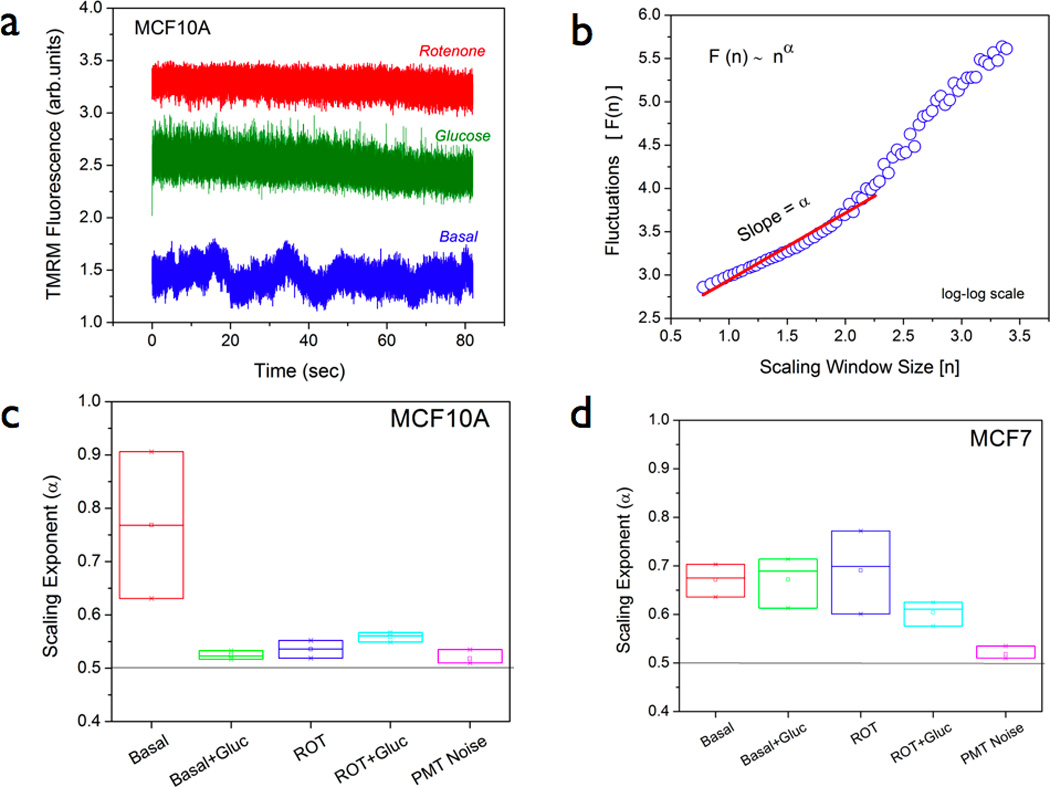
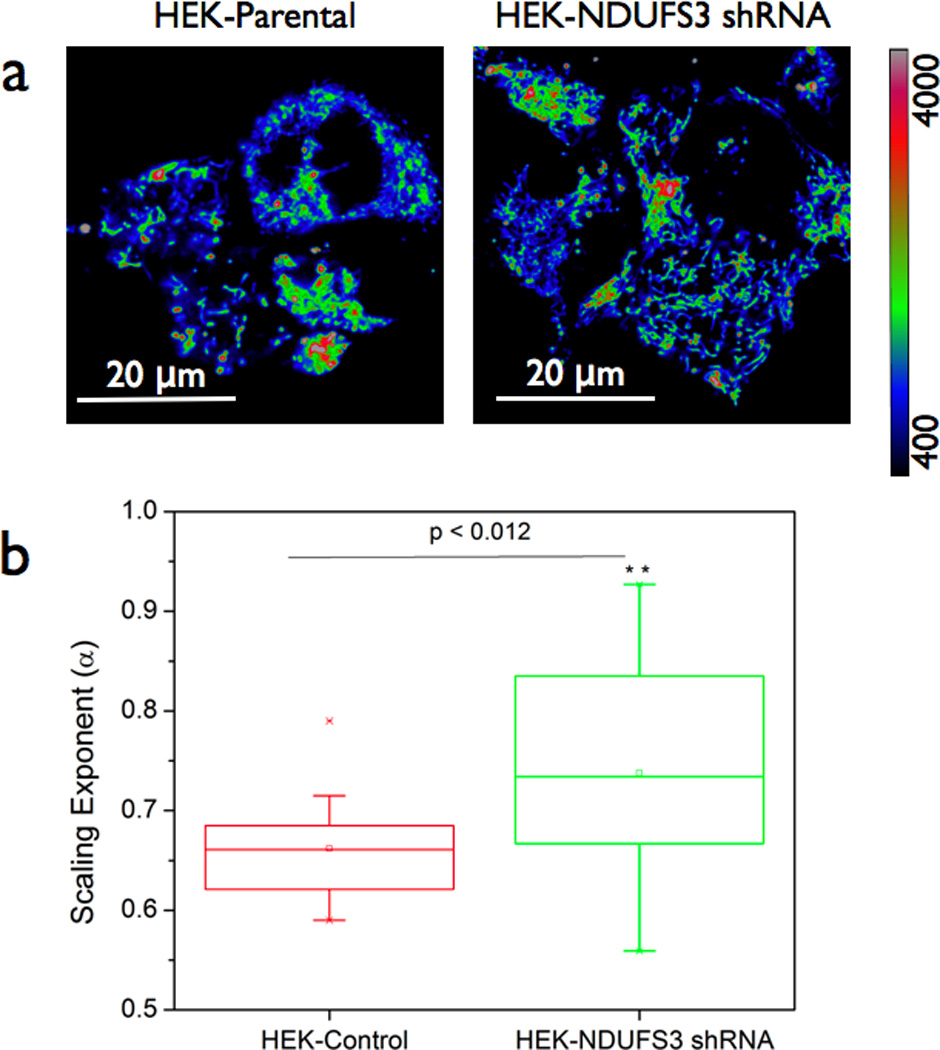
We report here a novel combination of time-resolved imaging methods for probing mitochondrial metabolism in multiple time scales at the level of single cells. By exploiting a mitochondrial membrane potential reporter fluorescence we demonstrate the single cell metabolic dynamics in time scales ranging from microseconds to seconds to minutes in response to glucose metabolism and mitochondrial perturbations in real time. Our results show that in comparison with normal human mammary epithelial cells, the breast cancer cells display significant alterations in metabolic responses at all measured time scales by single cell kinetics, fluorescence recovery after photobleaching and by scaling analysis of time-series data obtained from mitochondrial fluorescence fluctuations. Furthermore scaling analysis of time-series data in living cells with distinct mitochondrial dysfunction also revealed significant metabolic differences thereby suggesting the broader applicability (e.g. in mitochondrial myopathies and other metabolic disorders) of the proposed strategies beyond the scope of cancer metabolism. We discuss the scope of these findings in the context of developing portable, real-time metabolic measurement systems that can find applications in preclinical and clinical diagnostics.

Keywords: Breast cancer; Metabolic imaging; Microscopy; Mitochondria; NDUFS3; Scaling behavior.


Figures

Figure 1
Figure 1. Steady state mitochondrial status in normal and cancer cells
(a & b) Representative fluorescence images of normal (MCF10A) and breast cancer (MCF7) cells labeled with 200nM tetramethyl rhodamine methyl ester (TMRM) probe (1h, 37 °C). Mitochondrial localization and hence the concentration/fluorescence intensity of the probe is dependent on mitochondrial membrane potential. Scale bars = 20 µm. (c) Real-time probe uptake kinetics in MCF10A and MCF7 cells at room temperature as measured in a confocal microscope. Live cells in delta-T chambers were placed on the microscope stage and 200nM TMRM was added and time-lapse imaging was initiated immediately. (d) Statistical analyses of mitochondrial regions of interest (typical size 3µm × 3µm) from multiple images of both normal and cancer cells revealed no significant difference in steady state localization of the TMRM probe and hence in the mitochondrial membrane potential (ΔΨ) calculated on the basis of Nernst equilibrium [ΔΨ(mV) = −60 log [Fin/Fout] where Fin is the TMRM fluorescence intensity inside the mitochondrial matrix and Fout is the TMRM fluorescence intensity outside the cell (or cytoplasm). (e) Flow cytometry analysis of metabolic signals in normal and cancer cells : ean mitochondrial membrane potential (as measured by TMRM), mean mitochondrial mass (as measured by Mitotracker Green) and glucose uptake potential (as measured by 2NBDG). Note that reduction in mitochondrial membrane potential in cancer cells corresponded linearly with that of the reduction in mitochondrial mass thereby confirming that both these cell lines have near-identical mitochondrial membrane potential normalized to the mitochondrial mass.
Figure 2
Figure 2. Steady state mitochondrial membrane potential kinetics during glucose metabolism
(a & b) Representative fluorescence images of normal (MCF10A) and breast cancer (MCF7) cells pre-labeled with 200nM TMRM, with and without acute treatment with mitochondrial uncoupler FCCP. Scale bars = 20 µm. (b) & (c) Mean TMRM fluorescence decay kinetics in normal and cancer cells in response to 20mM glucose and 5µm FCCP stimuli respectively. As can be seen, the normal and cancer cells displayed significant differences in the kinetic rate constants as summarized in (d) [n = 3]. Statistical significance : p < 0.05
Figure 3
Figure 3. Fluorescence recovery after photobleaching (FRAP) imaging reveals metabolic rigidity in mitochondrial membrane potential reporter diffusion
(a & b) Representative images of MCF10A and MC7 cells pre-labeled with 200nM TMRM. Fluorescence recovery profiles (b) were monitored after photobleaching the indicated areas in the images. (c) Representative mean fluorescence recovery profiles (error bars indicate the standard deviation from multiple recovery profiles) of TMRM probe obtained from bleached and unbleached regions. Fluorescence variations in unbleached regions were negligible thereby indicating that no artifacts arising from apparent mitochondrial mobility and/or probe binding were observed during the fluorescence recovery measurements. Statistical analysis (d) of multiple regions (typical size 3µm × 3µm) clearly indicated that fluorescence recovery time was significantly higher in MCF7 cells as compared with the normal MCF10A cells. Since steady-state mitochondrial localization of the TMRM was found to be equal in both these cell lines (Figure 1), the difference in recovery times found in these cell lines are most likely due to functional differences in mitochondrial redistribution of the TMRM probe. (e) The recovery times were not found to have any significant dependence on the initial mitochondrial membrane potential value thereby ruling out any apparent artifacts due to differences in probe binding.
Figure 4
Figure 4. Nonlinear scaling analysis of TMRM fluorescence fluctuations in normal and cancer cells
(a) Representative time-series profiles of TMRM fluorescence fluctuations in MCF10A cells. Basal metabolism shows a dynamic picture of TMRM diffusion within a narrow measurement volume (typical size ~ 1µm) which changes drastically during glucose metabolism (20mM glucose stimulus) and mitochondrial complex I inhibition (40 minutes of 1µM rotenone treatment) conditions. (b) Detrended fluctuation analysis (DFA) of time-series data from multiple cells was performed to yield a log-log plot of fluctuations, F(n) and the window size (n) – as illustrated in (b). Scaling exponent (α) was computed as the slope of this scaling function F(n) ~ nα within the fitting range 0.5 < n < 2.5. (c) & (d) Summary of mean scaling exponents obtained from multiple (N ~20) time-series profiles in both normal and cancer cells pre-labeled with 200nM TMRM. For more details, see the main text.
Figure 5
Figure 5. Nonlinear scaling analysis of TMRM fluorescence fluctuations in isogenic HEK cells with mitochondrial dysfunction
(a) Human embryonic kidney (HEK) parental cells and isogenic HEK cells with genetically altered NDUFS3 (a catalytic subunit of mitochondrial complex I) expression. Scale bars = 20 µm. The latter cells were previously shown to display significant mitochondrial dysfunction and altered metabolic characteristics as described in Reference [26]. Flow cytometry measurements of steady state mitochondrial membrane potential (TMRM fluorescence) in these cells did not show significant difference (data not shown). However scaling exponent α as calculated from the time-series data was significantly different (p < 0.012) in these two cell lines (b) suggesting that the observed differences in metabolic response dynamics has a more fundamental origin in mitochondrial metabolism.

Similar articles

Cited by

References

    1. Mahe E, Ara S, Bishara M, Kurian A, Tauqir S, Ursani N, Vasudev P, Aziz T, Ross C, Lytwyn A. Can J Surg. 2013;56:E13–E18. - PMC - PubMed
    1. Lichtman MA. Oncologist. 2012;17:586. - PMC - PubMed
    1. Berney DM, Montironi R, Egevad L. Acta Oncol. 2011;50(Suppl 1):49–52. - PubMed
    1. Nakhleh RE. Arch Pathol Lab Med. 2006;130:630–632. - PubMed
    1. Raab SS, Grzybicki DM, Zarbo RJ, Meier FA, Geyer SJ, Jensen C. Arch Pathol Lab Med. 2005;129:1246–1251. - PubMed

Publication types

LinkOut - more resources