

Comparative electromechanical and hemodynamic effects of left ventricular and biventricular pacing in dyssynchronous heart failure: electrical resynchronization versus left-right ventricular interaction
- PMID: 24013057
- PMCID: PMC3985285
- DOI: 10.1016/j.jacc.2013.08.715
Comparative electromechanical and hemodynamic effects of left ventricular and biventricular pacing in dyssynchronous heart failure: electrical resynchronization versus left-right ventricular interaction
Abstract
Objectives: The purpose of this study was to enhance understanding of the working mechanism of cardiac resynchronization therapy by comparing animal experimental, clinical, and computational data on the hemodynamic and electromechanical consequences of left ventricular pacing (LVP) and biventricular pacing (BiVP).
Background: It is unclear why LVP and BiVP have comparative positive effects on hemodynamic function of patients with dyssynchronous heart failure.
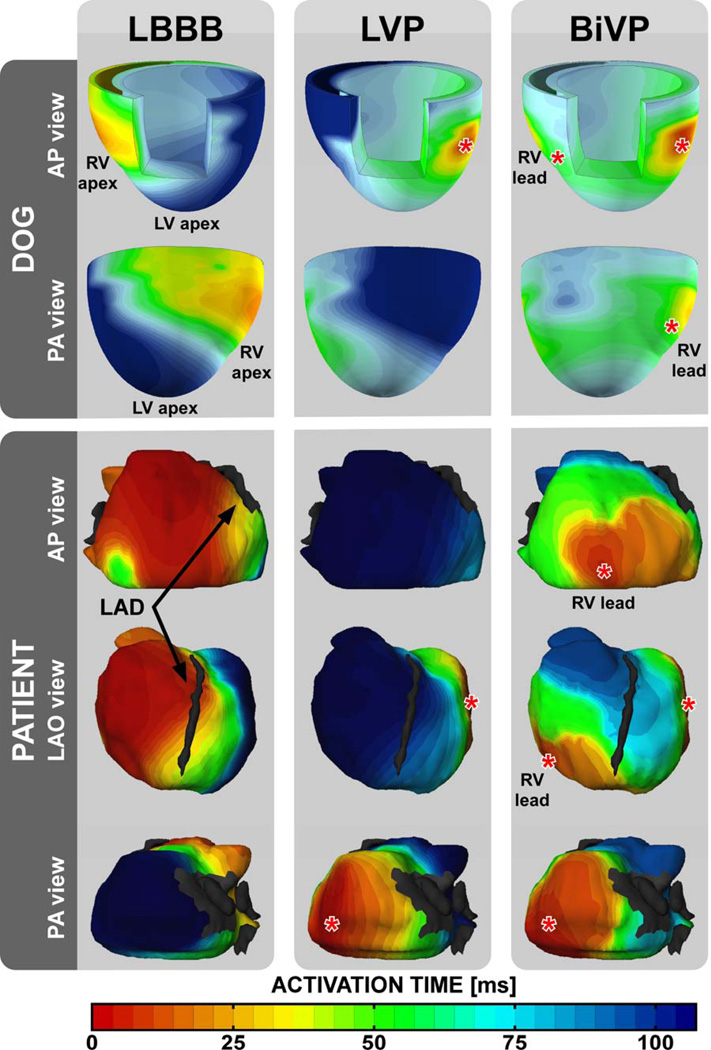
Methods: Hemodynamic response to LVP and BiVP (% change in maximal rate of left ventricular pressure rise [LVdP/dtmax]) was measured in 6 dogs and 24 patients with heart failure and left bundle branch block followed by computer simulations of local myofiber mechanics during LVP and BiVP in the failing heart with left bundle branch block. Pacing-induced changes of electrical activation were measured in dogs using contact mapping and in patients using a noninvasive multielectrode electrocardiographic mapping technique.
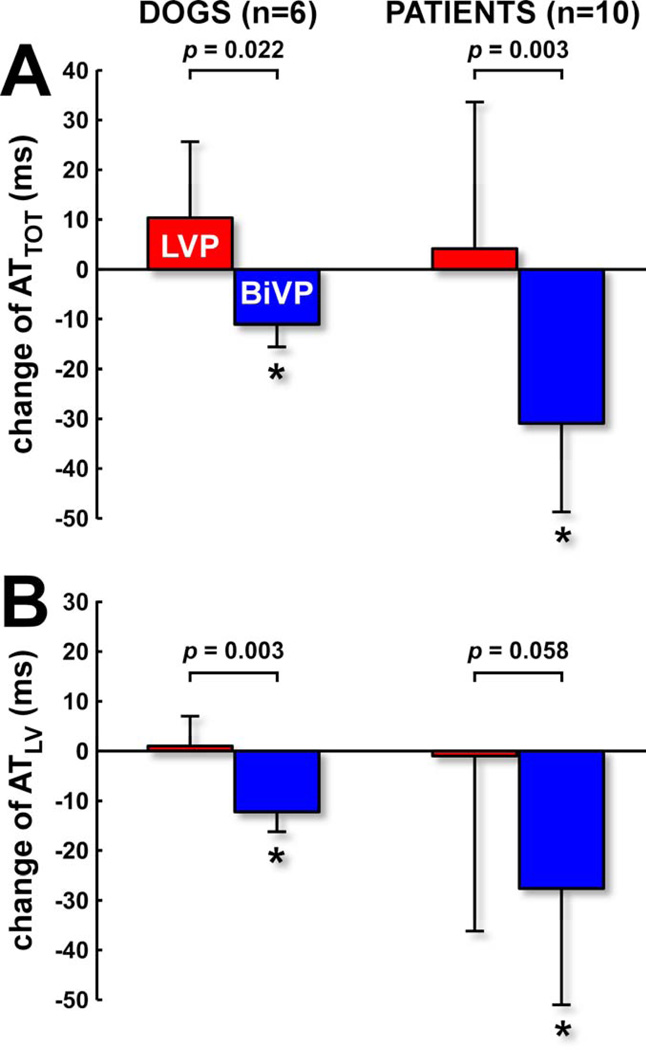
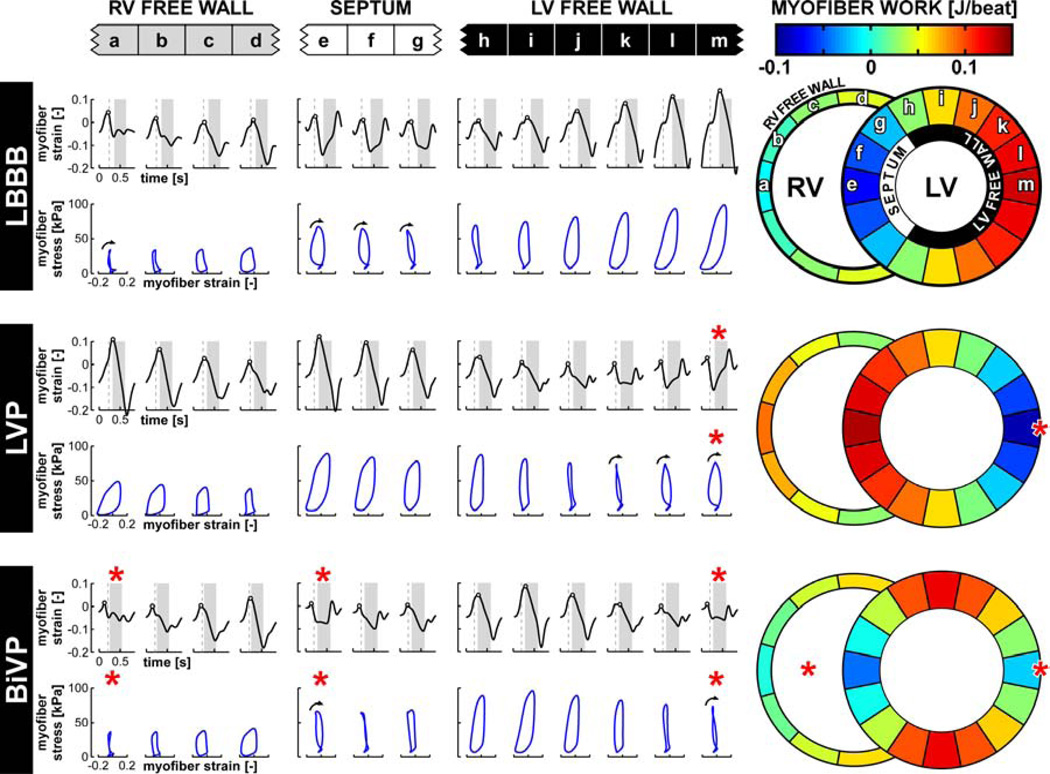
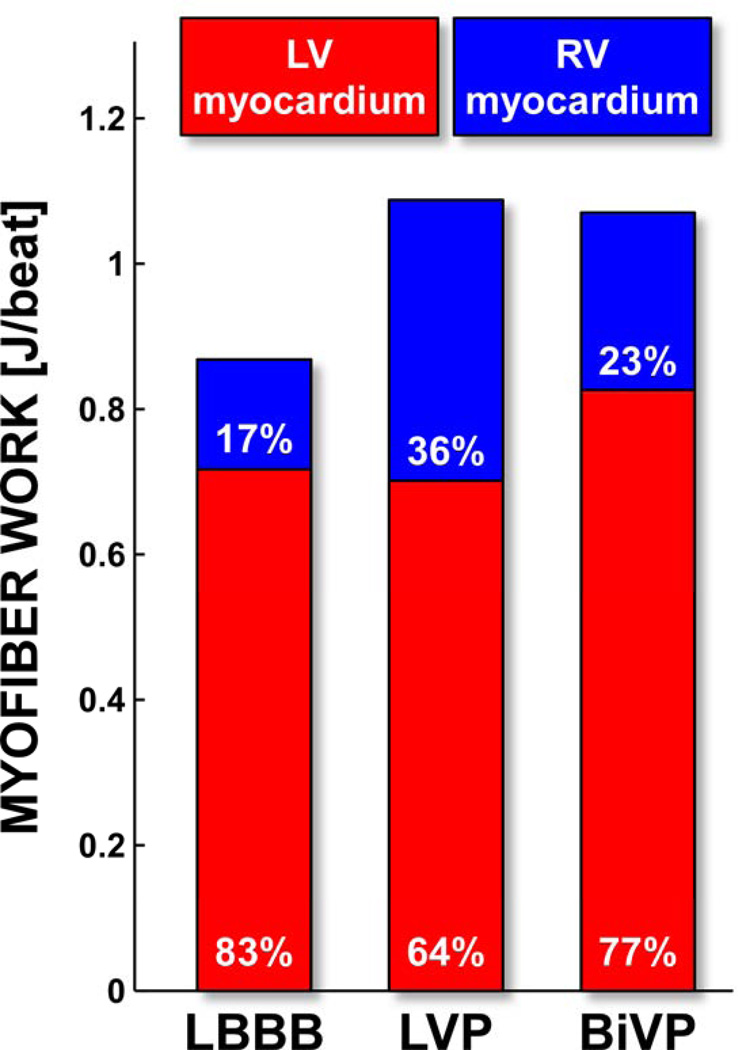
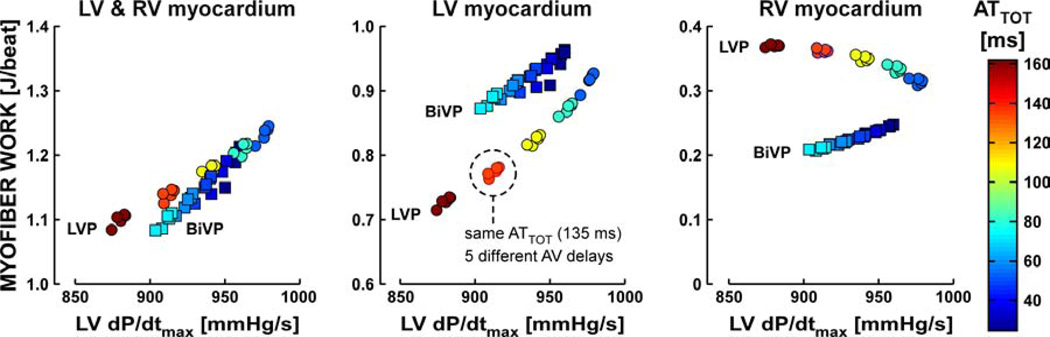
Results: LVP and BiVP similarly increased LVdP/dtmax in dogs and in patients, but only BiVP significantly decreased electrical dyssynchrony. In the simulations, LVP and BiVP increased total ventricular myofiber work to the same extent. While the LVP-induced increase was entirely due to enhanced right ventricular (RV) myofiber work, the BiVP-induced increase was due to enhanced myofiber work of both the left ventricle (LV) and RV. Overall, LVdP/dtmax correlated better with total ventricular myofiber work than with LV or RV myofiber work alone.
Conclusions: Animal experimental, clinical, and computational data support the similarity of hemodynamic response to LVP and BiVP, despite differences in electrical dyssynchrony. The simulations provide the novel insight that, through ventricular interaction, the RV myocardium importantly contributes to the improvement in LV pump function induced by cardiac resynchronization therapy.
Keywords: % change in maximal rate of left ventricular pressure rise; % change in maximal rate of right ventricular pressure rise; ANOVA; AT(TOT); AV; BiVP; CRT; ECM; HF; LBBB; LV; LVP; LVdP/dt(max); RV; RVdP/dt(max); analysis of variance; atrioventricular; biventricular pacing; cardiac resynchronization therapy; dyssynchrony; electrocardiographic mapping; electrophysiology mapping; heart failure; left bundle branch block; left ventricle/ventricular; left ventricular pacing; myocardial work; right ventricle/ventricular; total ventricular activation time; ventricular interaction.
Copyright © 2013 American College of Cardiology Foundation. Published by Elsevier Inc. All rights reserved.
Figures
Comment in
-
New insights into ventricular interactions during cardiac resynchronization.J Am Coll Cardiol. 2013 Dec 24;62(25):2404-2405. doi: 10.1016/j.jacc.2013.05.092. Epub 2013 Sep 4. J Am Coll Cardiol. 2013. PMID: 24013053 No abstract available.
Similar articles
-
Acute electrical and hemodynamic effects of multisite left ventricular pacing for cardiac resynchronization therapy in the dyssynchronous canine heart.Heart Rhythm. 2014 Jan;11(1):119-25. doi: 10.1016/j.hrthm.2013.10.018. Epub 2013 Oct 9. Heart Rhythm. 2014. PMID: 24120876
-
Acute biventricular hemodynamic effects of cardiac resynchronization therapy in right bundle branch block.Heart Rhythm. 2018 Oct;15(10):1525-1532. doi: 10.1016/j.hrthm.2018.05.017. Epub 2018 May 23. Heart Rhythm. 2018. PMID: 29800750
-
Interplay of electrical wavefronts as determinant of the response to cardiac resynchronization therapy in dyssynchronous canine hearts.Circ Arrhythm Electrophysiol. 2013 Oct;6(5):924-31. doi: 10.1161/CIRCEP.113.000753. Epub 2013 Sep 18. Circ Arrhythm Electrophysiol. 2013. PMID: 24047705
-
Cardiac resynchronization therapy improves left ventricular remodeling and function compared with right ventricular pacing in patients with atrioventricular block.Heart Fail Rev. 2018 Nov;23(6):919-926. doi: 10.1007/s10741-018-9722-z. Heart Fail Rev. 2018. PMID: 29968221 Review.
-
Impact of physiologic pacing versus right ventricular pacing among patients with left ventricular ejection fraction greater than 35%: A systematic review for the 2018 ACC/AHA/HRS guideline on the evaluation and management of patients with bradycardia and cardiac conduction delay: A Report of the American College of Cardiology/American Heart Association Task Force on Clinical Practice Guidelines and the Heart Rhythm Society.Heart Rhythm. 2019 Sep;16(9):e280-e298. doi: 10.1016/j.hrthm.2018.10.035. Epub 2018 Nov 6. Heart Rhythm. 2019. PMID: 30412776
Cited by
-
Rational and design of EuroCRT: an international observational study on multi-modality imaging and cardiac resynchronization therapy.Eur Heart J Cardiovasc Imaging. 2017 Oct 1;18(10):1120-1127. doi: 10.1093/ehjci/jex021. Eur Heart J Cardiovasc Imaging. 2017. PMID: 28329299 Free PMC article.
-
Non-invasive cardiac mapping for non-response in cardiac resynchronization therapy.Ann Med. 2019 Mar;51(2):109-117. doi: 10.1080/07853890.2019.1616109. Epub 2019 May 23. Ann Med. 2019. PMID: 31094217 Free PMC article. Review.
-
Improvement of Right Ventricular Hemodynamics with Left Ventricular Endocardial Pacing during Cardiac Resynchronization Therapy.Pacing Clin Electrophysiol. 2016 Jun;39(6):531-41. doi: 10.1111/pace.12854. Epub 2016 May 9. Pacing Clin Electrophysiol. 2016. PMID: 27001004 Free PMC article.
-
The Left and Right Ventricles Respond Differently to Variation of Pacing Delays in Cardiac Resynchronization Therapy: A Combined Experimental- Computational Approach.Front Physiol. 2019 Feb 1;10:17. doi: 10.3389/fphys.2019.00017. eCollection 2019. Front Physiol. 2019. PMID: 30774598 Free PMC article.
-
Simultaneous venous-arterial Doppler during preload augmentation: illustrating the Doppler Starling curve.Ultrasound J. 2023 Jul 28;15(1):32. doi: 10.1186/s13089-023-00330-9. Ultrasound J. 2023. PMID: 37505318 Free PMC article.
References
-
- Abraham WT, Fisher WG, Smith AL, et al. Cardiac resynchronization in chronic heart failure. N Engl J Med. 2002;346:1845–1853. - PubMed
-
- Cleland JG, Daubert JC, Erdmann E, et al. The effect of cardiac resynchronization on morbidity and mortality in heart failure. N Engl J Med. 2005;352:1539–1549. - PubMed
-
- Auricchio A, Stellbrink C, Block M, et al. Effect of pacing chamber and atrioventricular delay on acute systolic function of paced patients with congestive heart failure. The Pacing Therapies for Congestive Heart Failure Study Group. The Guidant Congestive Heart Failure Research Group. Circulation. 1999;99:2993–3001. - PubMed
-
- Blanc JJ, Etienne Y, Gilard M, et al. Evaluation of different ventricular pacing sites in patients with severe heart failure: results of an acute hemodynamic study. Circulation. 1997;96:3273–3277. - PubMed
-
- Etienne Y, Mansourati J, Gilard M, et al. Evaluation of left ventricular based pacing in patients with congestive heart failure and atrial fibrillation. Am J Cardiol. 1999;83:1138–1140. A9. - PubMed
Publication types
MeSH terms
Grants and funding
LinkOut - more resources
Full Text Sources
Other Literature Sources
Medical
Research Materials
Miscellaneous
