

Autocrine HBEGF expression promotes breast cancer intravasation, metastasis and macrophage-independent invasion in vivo
- PMID: 24013225
- PMCID: PMC3950352
- DOI: 10.1038/onc.2013.363
Autocrine HBEGF expression promotes breast cancer intravasation, metastasis and macrophage-independent invasion in vivo
Abstract
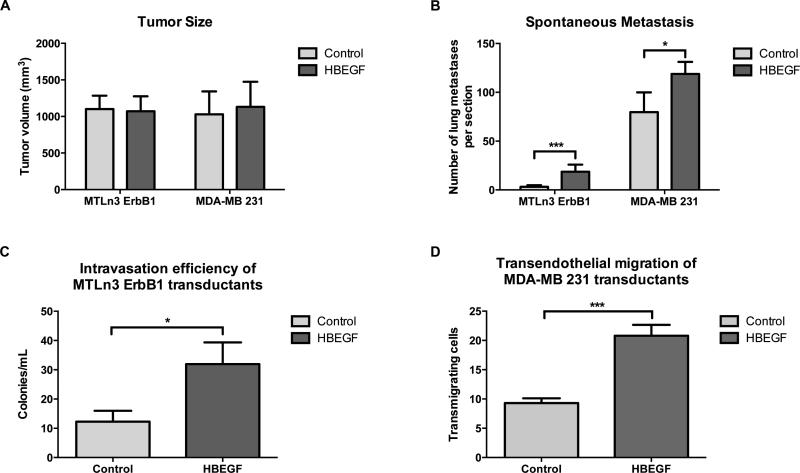
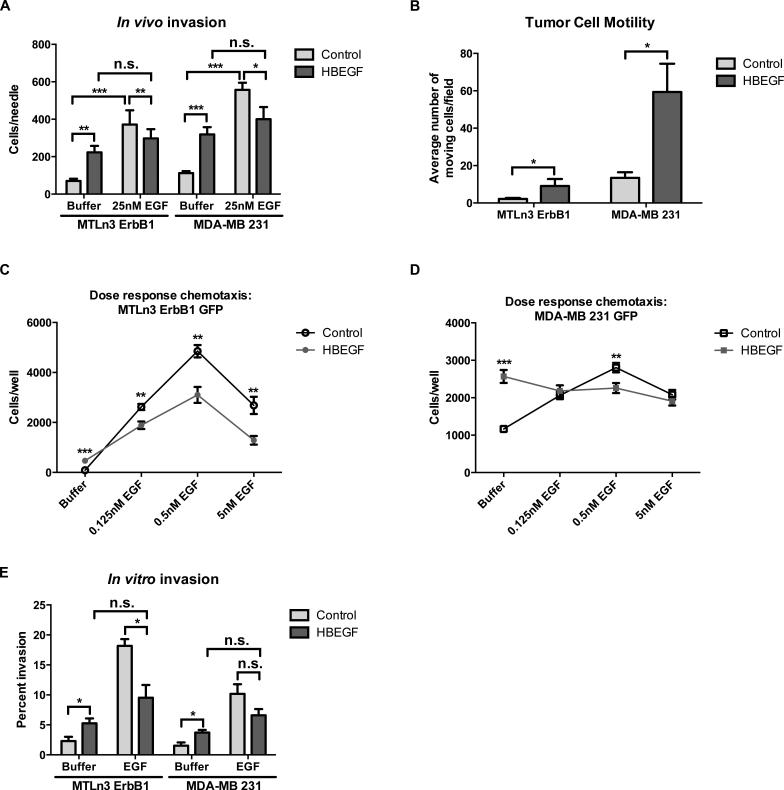
Increased expression of HBEGF in estrogen receptor-negative breast tumors is correlated with enhanced metastasis to distant organ sites and more rapid disease recurrence upon removal of the primary tumor. Our previous work has demonstrated a paracrine loop between breast cancer cells and macrophages in which the tumor cells are capable of stimulating macrophages through the secretion of colony-stimulating factor-1 while the tumor-associated macrophages (TAMs), in turn, aid in tumor cell invasion by secreting epidermal growth factor. To determine how the autocrine expression of epidermal growth factor receptor (EGFR) ligands by carcinoma cells would affect this paracrine loop mechanism, and in particular whether tumor cell invasion depends on spatial ligand gradients generated by TAMs, we generated cell lines with increased HBEGF expression. We found that autocrine HBEGF expression enhanced in vivo intravasation and metastasis and resulted in a novel phenomenon in which macrophages were no longer required for in vivo invasion of breast cancer cells. In vitro studies revealed that expression of HBEGF enhanced invadopodium formation, thus providing a mechanism for cell autonomous invasion. The increased invadopodium formation was directly dependent on EGFR signaling, as demonstrated by a rapid decrease in invadopodia upon inhibition of autocrine HBEGF/EGFR signaling as well as inhibition of signaling downstream of EGFR activation. HBEGF expression also resulted in enhanced invadopodium function via upregulation of matrix metalloprotease 2 (MMP2) and MMP9 expression levels. We conclude that high levels of HBEGF expression can short-circuit the tumor cell/macrophage paracrine invasion loop, resulting in enhanced tumor invasion that is independent of macrophage signaling.
Figures


Similar articles
-
Autocrine-derived epidermal growth factor receptor ligands contribute to recruitment of tumor-associated macrophage and growth of basal breast cancer cells in vivo.Oncol Res. 2013;20(7):303-17. doi: 10.3727/096504013x13639794277761. Oncol Res. 2013. PMID: 23879171 Free PMC article.
-
Autocrine expression of the epidermal growth factor receptor ligand heparin-binding EGF-like growth factor in cervical cancer.Int J Oncol. 2017 Jun;50(6):1947-1954. doi: 10.3892/ijo.2017.3980. Epub 2017 May 3. Int J Oncol. 2017. PMID: 28498437 Free PMC article.
-
Decreased autocrine EGFR signaling in metastatic breast cancer cells inhibits tumor growth in bone and mammary fat pad.PLoS One. 2012;7(1):e30255. doi: 10.1371/journal.pone.0030255. Epub 2012 Jan 19. PLoS One. 2012. PMID: 22276166 Free PMC article.
-
Amphiregulin as a novel target for breast cancer therapy.J Mammary Gland Biol Neoplasia. 2008 Jun;13(2):171-9. doi: 10.1007/s10911-008-9081-9. Epub 2008 Apr 25. J Mammary Gland Biol Neoplasia. 2008. PMID: 18437539 Review.
-
Diverse functions of HBEGF during pregnancy.Mol Reprod Dev. 2009 Dec;76(12):1116-27. doi: 10.1002/mrd.21066. Mol Reprod Dev. 2009. PMID: 19565643 Free PMC article. Review.
Cited by
-
EGFR regulates the development and microarchitecture of intratumoral angiogenic vasculature capable of sustaining cancer cell intravasation.Neoplasia. 2015 Aug;17(8):634-49. doi: 10.1016/j.neo.2015.08.002. Neoplasia. 2015. PMID: 26408256 Free PMC article.
-
TKS5-positive invadopodia-like structures in human tumor surgical specimens.Exp Mol Pathol. 2019 Feb;106:17-26. doi: 10.1016/j.yexmp.2018.11.005. Epub 2018 Nov 12. Exp Mol Pathol. 2019. PMID: 30439350 Free PMC article.
-
A Novel Inflammatory Response-Related Gene Signature Improves High-Risk Survival Prediction in Patients With Head and Neck Squamous Cell Carcinoma.Front Genet. 2022 Apr 11;13:767166. doi: 10.3389/fgene.2022.767166. eCollection 2022. Front Genet. 2022. PMID: 35480305 Free PMC article.
-
Tumor spheroid invasion in epidermal growth factor gradients revealed by a 3D microfluidic device.Phys Biol. 2022 Mar 10;19(3):10.1088/1478-3975/ac54c7. doi: 10.1088/1478-3975/ac54c7. Phys Biol. 2022. PMID: 35158347 Free PMC article.
-
A four gene signature predictive of recurrent prostate cancer.Oncotarget. 2017 Jan 10;8(2):3430-3440. doi: 10.18632/oncotarget.13837. Oncotarget. 2017. PMID: 27966447 Free PMC article.
References
-
- Jemal A, Siegel R, Xu J, Ward E. Cancer statistics, 2010. CA: a cancer journal for clinicians. 2010 Sep-Oct;60(5):277–300. PubMed PMID: 20610543. - PubMed
-
- Fidler IJ. The pathogenesis of cancer metastasis: the ‘seed and soil’ hypothesis revisited. Nature reviews Cancer. 2003 Jun;3(6):453–8. PubMed PMID: 12778135. - PubMed
-
- Artacho-Cordon A, Artacho-Cordon F, Rios-Arrabal S, Calvente I, Nunez MI. Tumor microenvironment and breast cancer progression: a complex scenario. Cancer biology & therapy. 2012 Jan 1;13(1):14–24. PubMed PMID: 22336584. - PubMed
-
- Xue C, Wyckoff J, Liang F, Sidani M, Violini S, Tsai KL, et al. Epidermal growth factor receptor overexpression results in increased tumor cell motility in vivo coordinately with enhanced intravasation and metastasis. Cancer research. 2006 Jan 1;66(1):192–7. PubMed PMID: 16397232. - PubMed
Publication types
MeSH terms
Substances
Grants and funding
LinkOut - more resources
Full Text Sources
Other Literature Sources
Medical
Research Materials
Miscellaneous
