

Chemometric Resolution and Quantification of Four-Way Data Arising from Comprehensive 2D-LC-DAD Analysis of Human Urine
- PMID: 24013363
- PMCID: PMC3762254
- DOI: 10.1016/j.chemolab.2010.07.008
Chemometric Resolution and Quantification of Four-Way Data Arising from Comprehensive 2D-LC-DAD Analysis of Human Urine
Abstract
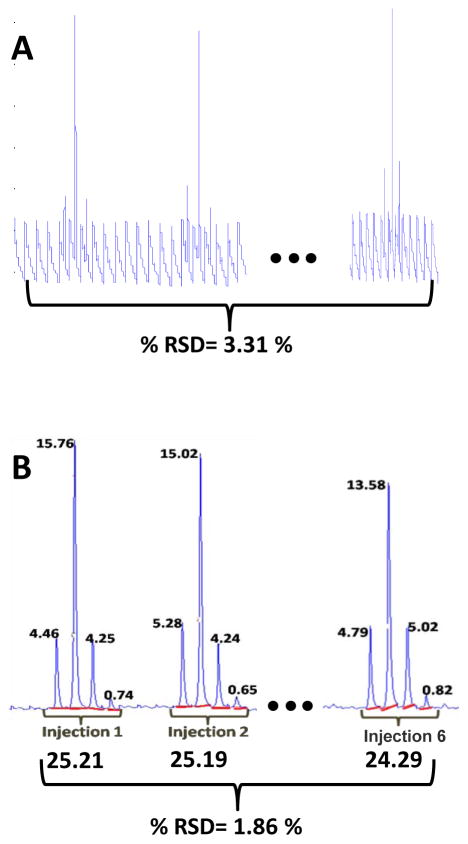
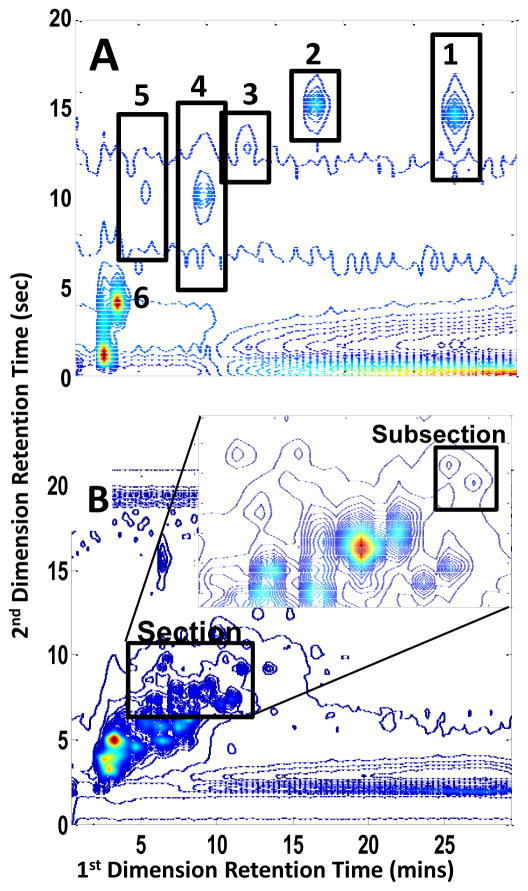
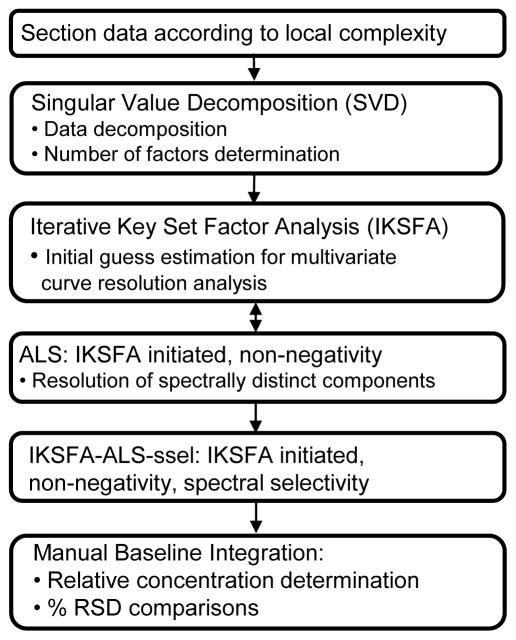
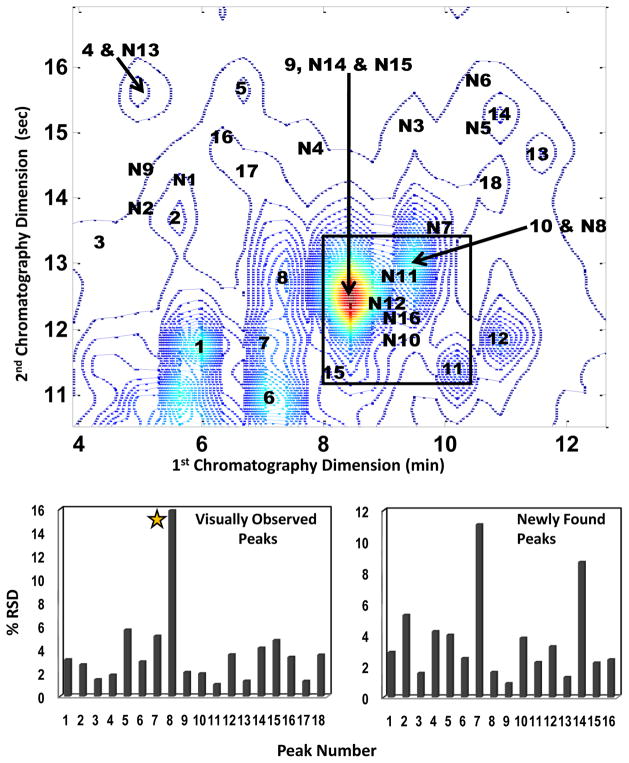
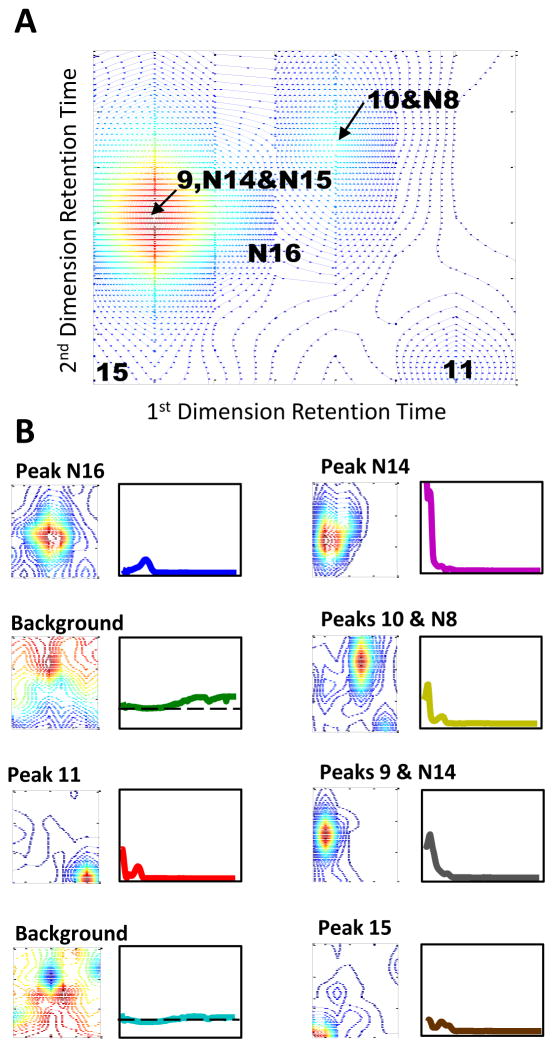
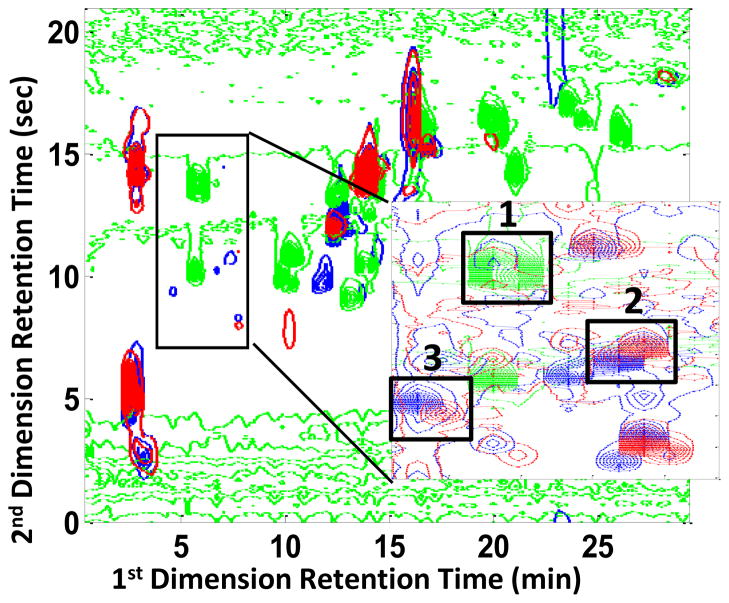
Two-dimensional liquid chromatography (LC×LC) is quickly becoming an important technique for the analysis of complex samples, owing largely to the relatively high peak capacities attainable by this analytical technique. With the increase in the complexity of the sample comes a corresponding increase in the complexity of the collected data. Thus the need for chemometric methods capable of resolving and quantifying such data is ever more urgent in order to obtain the maximum information available from the data. To this end, we have developed a chemometric method that combines iterative key set factor analysis and multivariate curve resolution-alternating least squares analysis with a spectral selectivity constraint that is shown to be capable of resolving chromatographically rank deficient, non-multilinear data. (Spectrally rank deficient compounds can only be quantified if the peaks having the same spectra are chromatographically resolved.) Over 50 chromatographic peaks were found in a relatively small section of a LC×LC-diode array data set of replicate urine samples (a four-way data set) using the developed method. The relative concentrations for 34 of the 50 peaks were determined with % RSD values ranging from 0.09 % to 16 %.
Keywords: 2D liquid chromatography; alternating least squares; iterative key set factor analysis; multivariate curve resolution.
Figures
Similar articles
-
Two dimensional assisted liquid chromatography - a chemometric approach to improve accuracy and precision of quantitation in liquid chromatography using 2D separation, dual detectors, and multivariate curve resolution.Anal Chim Acta. 2015 Feb 15;859:87-95. doi: 10.1016/j.aca.2014.12.009. Epub 2014 Dec 10. Anal Chim Acta. 2015. PMID: 25622610
-
Factors that affect quantification of diode array data in comprehensive two-dimensional liquid chromatography using chemometric data analysis.J Chromatogr A. 2011 Nov 18;1218(46):8411-22. doi: 10.1016/j.chroma.2011.09.057. Epub 2011 Sep 29. J Chromatogr A. 2011. PMID: 21995858
-
Analysis of four-way two-dimensional liquid chromatography-diode array data: application to metabolomics.Anal Chem. 2006 Aug 1;78(15):5559-69. doi: 10.1021/ac0606195. Anal Chem. 2006. PMID: 16878896
-
Review of chemometric analysis techniques for comprehensive two dimensional separations data.J Chromatogr A. 2012 Sep 14;1255:3-11. doi: 10.1016/j.chroma.2012.05.050. Epub 2012 Jun 7. J Chromatogr A. 2012. PMID: 22727556 Review.
-
Application of comprehensive 2D chromatography in the anti-doping field: Sample identification and quantification.J Chromatogr B Analyt Technol Biomed Life Sci. 2021 Jul 15;1178:122584. doi: 10.1016/j.jchromb.2021.122584. Epub 2021 Feb 21. J Chromatogr B Analyt Technol Biomed Life Sci. 2021. PMID: 34224963 Review.
Cited by
-
Recent applications of chemometrics in one- and two-dimensional chromatography.J Sep Sci. 2020 May;43(9-10):1678-1727. doi: 10.1002/jssc.202000011. Epub 2020 Mar 19. J Sep Sci. 2020. PMID: 32096604 Free PMC article. Review.
-
Chromatographic Applications in the Multi-Way Calibration Field.Molecules. 2021 Oct 21;26(21):6357. doi: 10.3390/molecules26216357. Molecules. 2021. PMID: 34770766 Free PMC article. Review.
-
Investigation of interpolation techniques for the reconstruction of the first dimension of comprehensive two-dimensional liquid chromatography-diode array detector data.Anal Chim Acta. 2011 Oct 31;705(1-2):253-60. doi: 10.1016/j.aca.2011.06.022. Epub 2011 Jun 23. Anal Chim Acta. 2011. PMID: 21962368 Free PMC article.
-
Automated peak detection and matching algorithm for gas chromatography-differential mobility spectrometry.Anal Chem. 2011 Mar 1;83(5):1537-46. doi: 10.1021/ac102110y. Epub 2011 Jan 4. Anal Chem. 2011. PMID: 21204557 Free PMC article.
-
Semi-automated alignment and quantification of peaks using parallel factor analysis for comprehensive two-dimensional liquid chromatography-diode array detector data sets.Anal Chim Acta. 2012 Apr 20;723:7-17. doi: 10.1016/j.aca.2012.02.019. Epub 2012 Feb 19. Anal Chim Acta. 2012. PMID: 22444567 Free PMC article.
References
-
- Pierce KM, Hoggard JC, Mohler RE, Synovec RE. Recent advances in comprehensive two-dimensional separations with chemometrics. J Chromatogr A. 2008;1184:341–352. - PubMed
-
- Porter SEG, Stoll DR, Rutan SC, Carr PW, Cohen JD. Analysis of four-way 2-D LC-DAD: Application to metabolomics. Anal Chem. 2006;78:5559–5569. - PubMed
-
- Stoll DR, Cohen JD, Carr PW. Fast, comprehensive online two-dimensional high performance liquid chromatography through the use of high temperature ultra-fast gradient elution reversed-phase liquid chromatography. J Chromatogr A. 2006;1122:123–137. - PubMed
-
- Daszykowski M, Wu W, Nicholls AW, Ball RJ, Czekaj T, Walczak B. Identifying potential biomarkers in LC-MS data. J Chemom. 2007;21:292–302.
Grants and funding
LinkOut - more resources
Full Text Sources
Other Literature Sources