

Examination of artificial MiRNA mimics with centered-site complementarity for gene targeting
- PMID: 24013456
- PMCID: PMC3754971
- DOI: 10.1371/journal.pone.0072062
Examination of artificial MiRNA mimics with centered-site complementarity for gene targeting
Abstract
Background: MiRNA primarily acts to repress gene expression at the post-transcriptional level through imperfect complementarity of its 5' region to the "seed site" in the 3' untranslated region of target mRNAs, with its "3'-supplementary site" and "center site" also playing important roles under certain circumstances. The aim of this study was to test if artificial miRNA mimics (miR-Mimics) that are designed to target the "centered sites" without "seed sites" complementarity are able to repress gene expression as natural miRNAs.
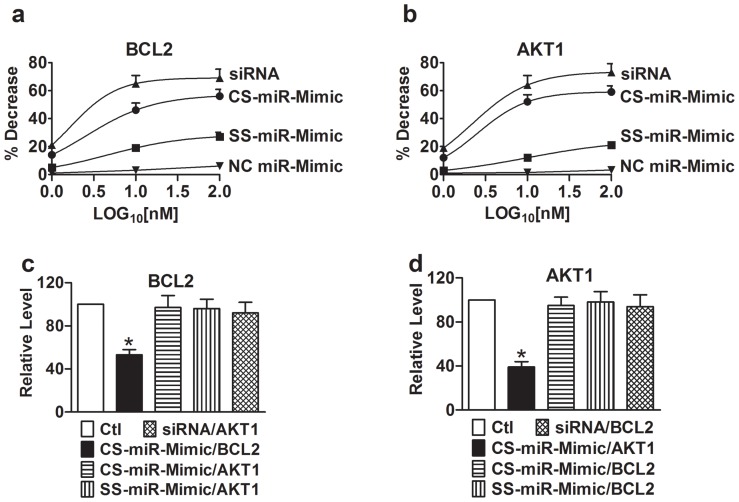
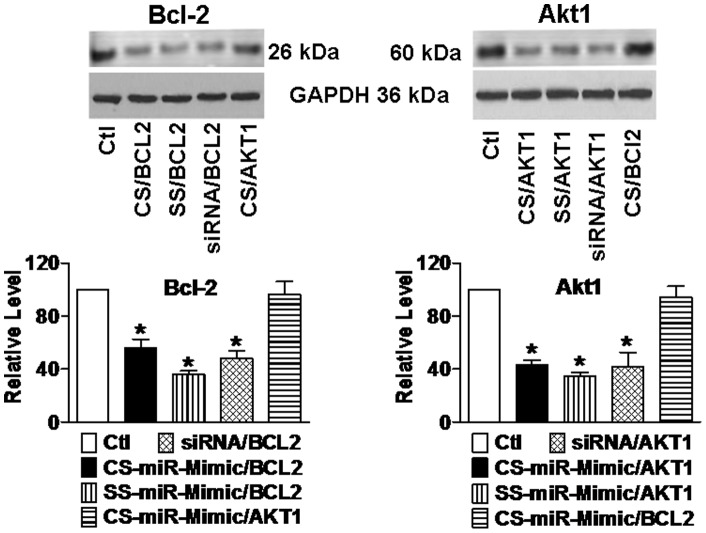
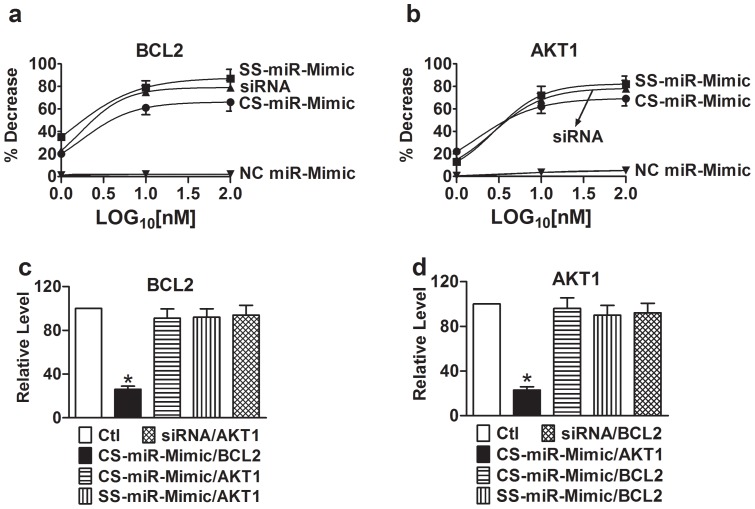
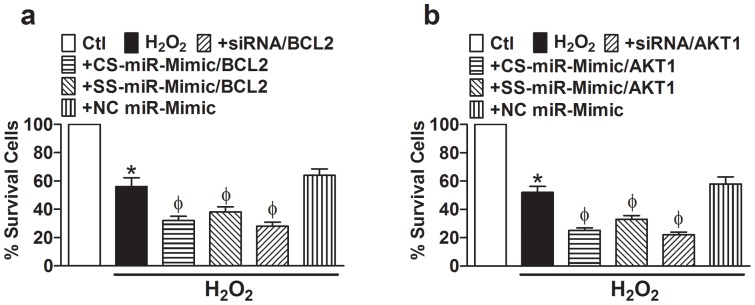
Methods: We designed miR-Mimics carrying centered-site matches (CS-miR-Mimics) or seed-site matches (SS-miR-Mimics) and siRNA to two antiapoptotic genes BCL2 and AKT1. We tested the gene targeting of these constructs using real-time RT-PCR and Western blot to quantify mRNA and protein levels of BCL2 and AKT1, respectively, luciferase reporter gene assay to investigate the interaction between miR-Mimics and their target sites, and cell survival assay to study the functional outcomes of the miR-Mimics.
Results: We found that CS-miR-Mimic, SS-miR-Mimic and siRNA, all down regulated the mRNA and protein levels of their cognate target BCL2 or AKT1 in a concentration-dependent manner. Luciferase reporter gene assay further confirmed the functional interactions of CS-miR-Mimic, SS-miR-Mimic and siRNA with their target sites. We then observed that the miR-Mimics and siRNAs were all able to induce cell death, as indicated by the reduced survival rate of cells.
Conclusions: We have provided evidence for the feasibility of CS-miR-Mimics for post-transcriptional repression of genes, which can be designed to have reduced numbers of seed type off-target sites compared to the number of target sites from an average endogenous seed-site miRNA. CS-miR-Mimics may be a novel approach for miRNA research requiring miRNA gain-of-function.
Conflict of interest statement
Figures

Similar articles
-
Systematic design and functional analysis of artificial microRNAs.Nucleic Acids Res. 2014 May;42(9):6064-77. doi: 10.1093/nar/gku171. Epub 2014 Mar 5. Nucleic Acids Res. 2014. PMID: 24598260 Free PMC article.
-
Overexpression of microRNA-30a-5p inhibits liver cancer cell proliferation and induces apoptosis by targeting MTDH/PTEN/AKT pathway.Tumour Biol. 2016 May;37(5):5885-95. doi: 10.1007/s13277-015-4456-1. Epub 2015 Nov 21. Tumour Biol. 2016. PMID: 26589417
-
Dose-dependent differential mRNA target selection and regulation by let-7a-7f and miR-17-92 cluster microRNAs.RNA Biol. 2012 Oct;9(10):1275-87. doi: 10.4161/rna.21998. Epub 2012 Sep 20. RNA Biol. 2012. PMID: 22995834 Free PMC article.
-
The proto-oncogene Pim-1 is a target of miR-33a.Oncogene. 2012 Feb 16;31(7):918-28. doi: 10.1038/onc.2011.278. Epub 2011 Jul 11. Oncogene. 2012. PMID: 21743487
-
Effective tools for RNA-derived therapeutics: siRNA interference or miRNA mimicry.Theranostics. 2021 Aug 11;11(18):8771-8796. doi: 10.7150/thno.62642. eCollection 2021. Theranostics. 2021. PMID: 34522211 Free PMC article. Review.
Cited by
-
MicroRNA-766-3p Contributes to Anti-Inflammatory Responses through the Indirect Inhibition of NF-κB Signaling.Int J Mol Sci. 2019 Feb 14;20(4):809. doi: 10.3390/ijms20040809. Int J Mol Sci. 2019. PMID: 30769772 Free PMC article.
-
Noncoding RNA as regulators of cardiac fibrosis: current insight and the road ahead.Pflugers Arch. 2016 Jun;468(6):1103-11. doi: 10.1007/s00424-016-1792-y. Epub 2016 Jan 20. Pflugers Arch. 2016. PMID: 26786602 Review.
-
Foxo3a-mediated overexpression of microRNA-622 suppresses tumor metastasis by repressing hypoxia-inducible factor-1α in ERK-responsive lung cancer.Oncotarget. 2015 Dec 29;6(42):44222-38. doi: 10.18632/oncotarget.5826. Oncotarget. 2015. PMID: 26528854 Free PMC article.
-
In silico and in vitro analysis of the impact of single substitutions within EXO-motifs on Hsa-MiR-1246 intercellular transfer in breast cancer cell.J Appl Genet. 2023 Feb;64(1):105-124. doi: 10.1007/s13353-022-00730-y. Epub 2022 Nov 17. J Appl Genet. 2023. PMID: 36394782 Free PMC article.
-
Artificial microRNA mediated gene silencing in plants: progress and perspectives.Plant Mol Biol. 2014 Sep;86(1-2):1-18. doi: 10.1007/s11103-014-0224-7. Epub 2014 Jul 15. Plant Mol Biol. 2014. PMID: 25022825 Review.
References
-
- Miranda KC, Huynh T, Tay Y, Ang YS, Tam WL, et al. (2006) A pattern-based method for the identification of MicroRNA binding sites and their corresponding heteroduplexes. Cell 126: 1203–1217. - PubMed
-
- Lewis BP, Shih IH, Jones-Rhoades MW, Bartel DP, Burge CB (2003) Prediction of mammalian microRNA targets. Cell 115: 787–798. - PubMed
-
- Lewis BP, Burge CB, Bartel DP (2005) Conserved seed pairing, often flanked by adenosines, indicates that thousands of human genes are microRNA targets. Cell 120: 15–20. - PubMed
Publication types
MeSH terms
Substances
LinkOut - more resources
Full Text Sources
Other Literature Sources
Miscellaneous
