. 2013 Sep 1;27(17):1868-85.
doi: 10.1101/gad.224386.113.

The C terminus of p53 regulates gene expression by multiple mechanisms in a target- and tissue-specific manner in vivo

Affiliations

The C terminus of p53 regulates gene expression by multiple mechanisms in a target- and tissue-specific manner in vivo

Pierre-Jacques Hamard et al. Genes Dev. .

Abstract

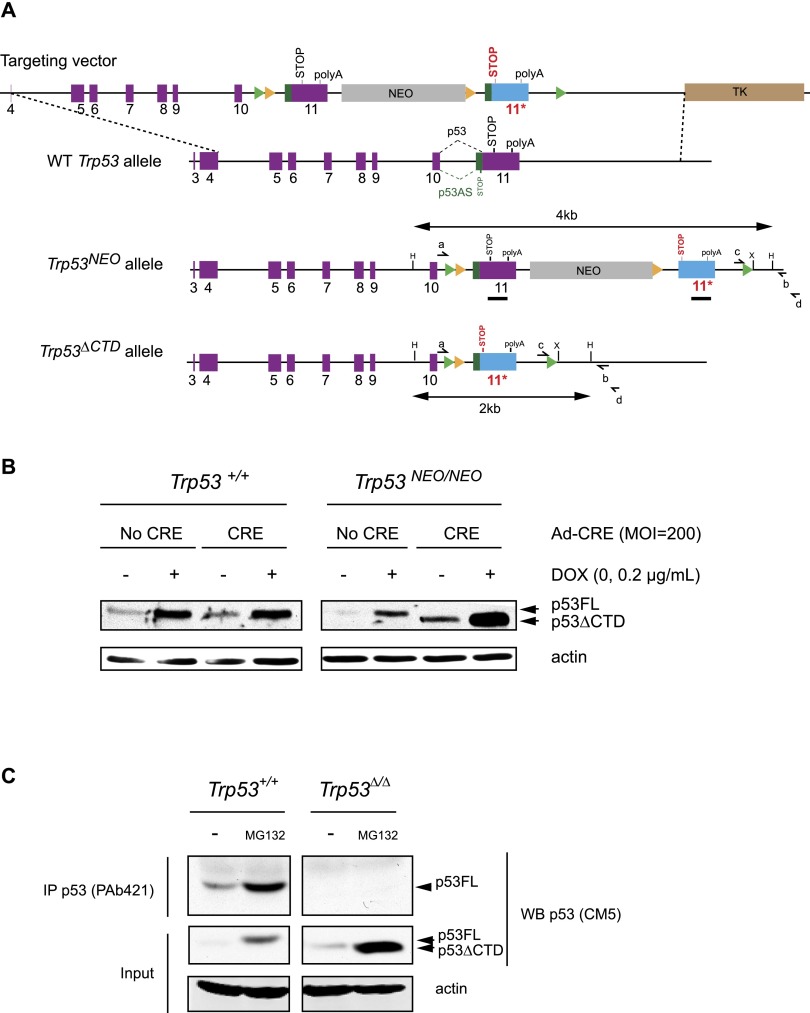
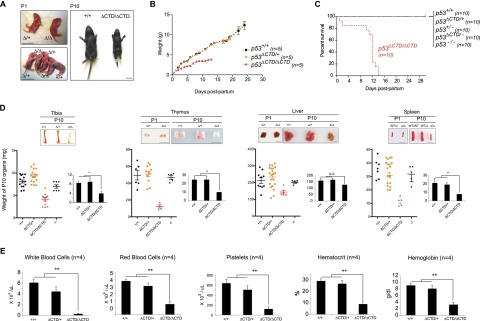
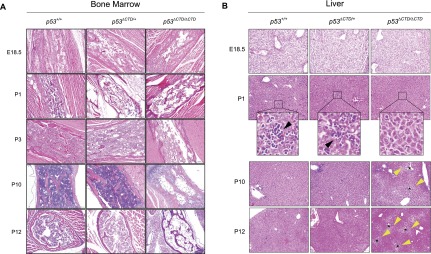
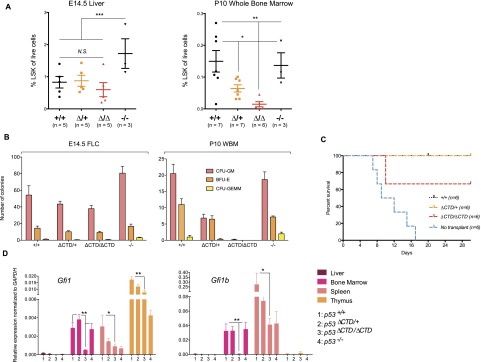
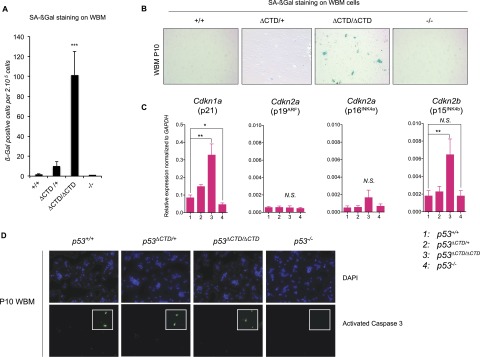
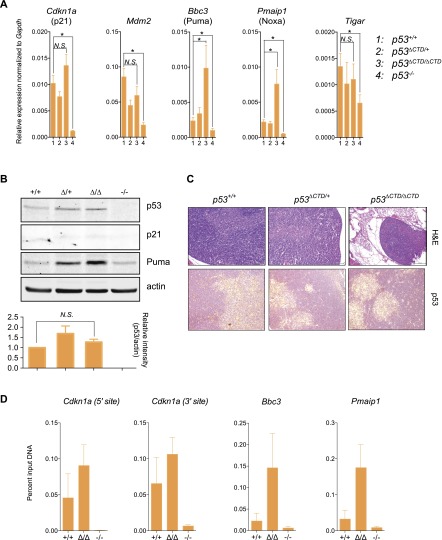
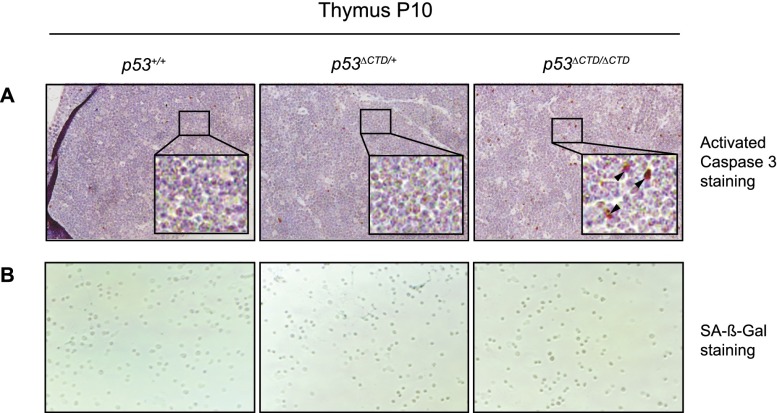
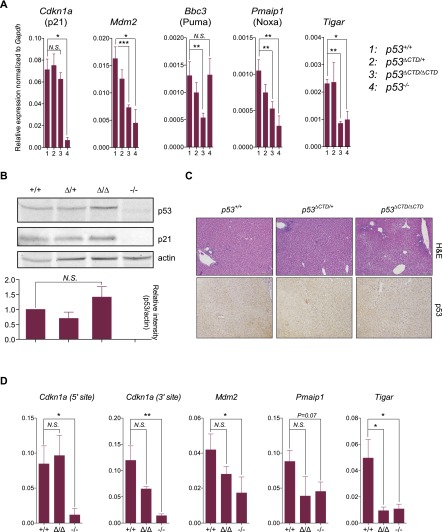
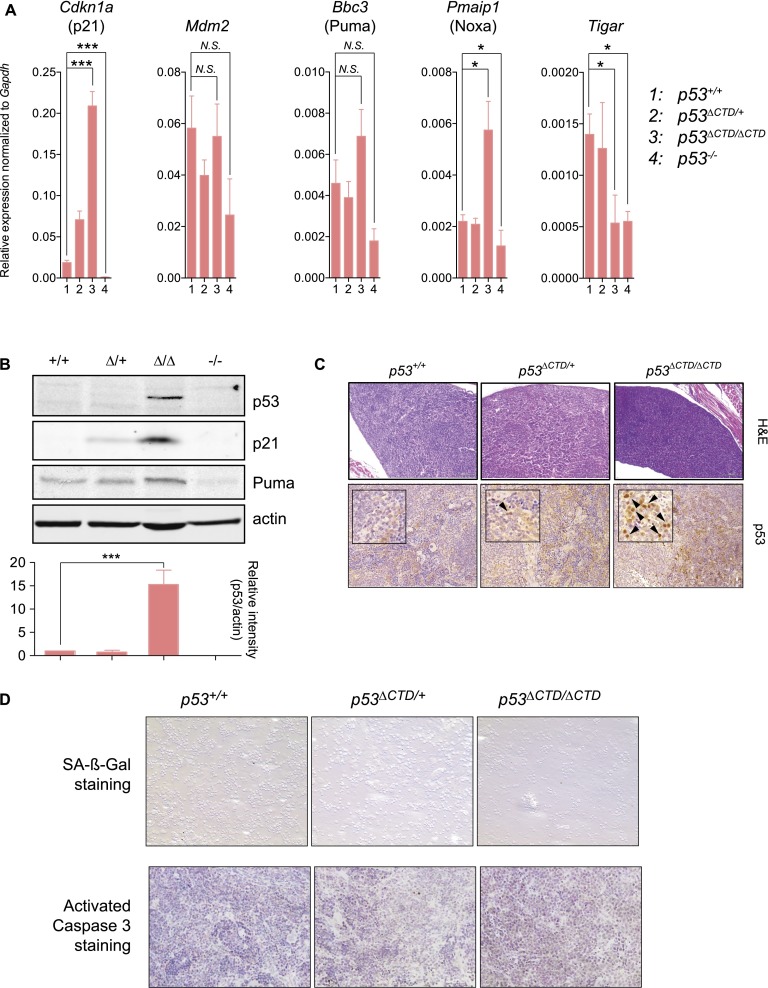
The p53 tumor suppressor is a transcription factor that mediates varied cellular responses. The C terminus of p53 is subjected to multiple and diverse post-translational modifications. An attractive hypothesis is that differing sets of combinatorial modifications therein determine distinct cellular outcomes. To address this in vivo, a Trp53(ΔCTD/ΔCTD) mouse was generated in which the endogenous p53 is targeted and replaced with a truncated mutant lacking the C-terminal 24 amino acids. These Trp53(ΔCTD/ΔCTD) mice die within 2 wk post-partum with hematopoietic failure and impaired cerebellar development. Intriguingly, the C terminus acts via three distinct mechanisms to control p53-dependent gene expression depending on the tissue. First, in the bone marrow and thymus, the C terminus dampens p53 activity. Increased senescence in the Trp53(ΔCTD/ΔCTD) bone marrow is accompanied by up-regulation of Cdkn1 (p21). In the thymus, the C-terminal domain negatively regulates p53-dependent gene expression by inhibiting promoter occupancy. Here, the hyperactive p53(ΔCTD) induces apoptosis via enhanced expression of the proapoptotic Bbc3 (Puma) and Pmaip1 (Noxa). In the liver, a second mechanism prevails, since p53(ΔCTD) has wild-type DNA binding but impaired gene expression. Thus, the C terminus of p53 is needed in liver cells at a step subsequent to DNA binding. Finally, in the spleen, the C terminus controls p53 protein levels, with the overexpressed p53(ΔCTD) showing hyperactivity for gene expression. Thus, the C terminus of p53 regulates gene expression via multiple mechanisms depending on the tissue and target, and this leads to specific phenotypic effects in vivo.

Keywords: C terminus; gene expression; hematopoiesis; mouse; p53; tissue specificity.


Figures

Figure 1.
Figure 1.
Generation of mice expressing a p53 protein devoid of its C-terminal domain. (A) Schematic of the targeting construct harboring two exon 11s separated by a NEO selection cassette. The resulting targeted Trp53NEO allele contains a wild-type exon 11 in frame with the rest of the gene and enables for the expression of a FL, wild-type p53 protein along with the shorter mouse-specific alternative spliced form (p53AS). After CRE recombination, the first wild-type exon 11 and the NEO cassette are excised, resulting in a Trp53ΔCTD allele that contains the second exon 11, which includes a STOP mutation at position 367. The Trp53ΔCTD allele encodes for a truncated p53 protein (p53ΔCTD) that lacks the last 24 amino acids as well as the p53AS isoform. The genotyping strategies are detailed in the Supplemental Material and Supplemental Figure 1. (Yellow triangles) loxP sites; (green triangles) FRT sites; (H) HindIII; (X) XhoI; (black bar) Southern blot probe; (a & b, c, and d) primers used for genotyping; (TK) thymidine kinase. (B) Immunoblot shows p53 protein expression in MEFs derived from Trp53+/+ and Trp53NEO/NEO animals before or after CRE recombination. The cells were infected with an adenovirus expressing the CRE recombinase at MOI = 200 to induce the expression of the truncated form. Twenty-four hours later, cells were treated with DOX at the final concentration of 0.2 μg/mL to reach appreciable levels of p53, and 24 h after treatment, cells were harvested, and immunoblotting analysis was conducted. β-Actin was used as a loading control. p53FL and p53ΔCTD are almost indistinguishable in size, and long running times and large gels were necessary to observe the difference in migration. (C) Immunoprecipitation of p53 in MEFs derived from Trp53+/+ and Trp53ΔCTD/ΔCTD animals with the p53CTD-specific monoclonal antibody PAb421. The cells were treated for 6 h with the proteasome inhibitor MG132 at a final concentration of 40 μM to reach appreciable levels of p53. The PAb421 antibody fails at precipitating the truncated p53 protein from Trp53ΔCTD/ΔCTD cells. A 5% input was immunoblotted for p53, and β-actin was used as a loading control.
Figure 2.
Figure 2.
Deletion of the C-terminal 24 amino acids from p53 leads to postnatal developmental defects and death within 2 wk post-partum. (A) Pictures of whole animals at P1 show no difference between littermates of different genotypes (Trp53+/+, Trp53ΔCTD/+, and Trp53ΔCTD/ΔCTD). At P10, Trp53ΔCTD/ΔCTD animals are smaller than their wild-type counterparts and exhibit several developmental defects, including kinked tails, abnormal tail tip, and digit pigmentation. Bar, 1 cm. (B) Weight curve shows marked growth retardation for Trp53ΔCTD/ΔCTD animals but no significant difference between Trp53+/+ and Trp53ΔCTD/+ mice. (C) Survival curves spanning 30 d post-partum illustrate 100% death within 2 wk for Trp53ΔCTD/ΔCTD animals, whereas all other genotypes survive. (D) Pictures of P1 and P10 whole organs demonstrate no significant difference between all genotypes at P1 but marked anemia and reduction in size for most Trp53ΔCTD/ΔCTD organs at P10. Weight graphs of P10 whole organs show reduced weight for Trp53ΔCTD/ΔCTD spleen, thymus, and tibias but not the liver and no significant difference between Trp53+/+ and Trp53ΔCTD/+ organs. Bar, 0.4 cm. (E) Complete blood counts reveal a marked reduction of white and red blood cells, platelets, hematocrit percentage, and hemoglobin concentration in Trp53ΔCTD/ΔCTD animals at P10.
Figure 3.
Figure 3.
Deletion of the C-terminal 24 amino acids from p53 induces hematopoietic failure post-partum. (A) Bone sections stained with haematoxylin and eosin (H&E) from Trp53+/+, Trp53ΔCTD/+, and Trp53ΔCTD/ΔCTD animals of the indicated ages. No difference is observed at E18.5 among all phenotypes, but a progressive hematopoietic failure is seen as soon as P1 only in Trp53ΔCTD/ΔCTD animals. (B) Liver sections stained with H&E show no difference between E18.5 Trp53+/+, Trp53ΔCTD/+, and Trp53ΔCTD/ΔCTD animals and an impaired EMH (indicated by black arrowheads) starting as soon as P1 only in Trp53ΔCTD/ΔCTD animals. Centrilobular degeneration (yellow arrowheads) is observed over the regions surrounding the central vein (black asterisks). Bar, 200 μm.
Figure 4.
Figure 4.
HSC homeostasis is perturbed in Trp53ΔCTD/ΔCTD mice. (A) Percentages of LSK cells from E14.5 fetal liver and P10 whole bone marrow show decreased numbers of HSCs in the bone marrow. Bars indicate SEM. (*) P < 0.05; (**) P < 0.01; (***) P < 0.001 (one-way ANOVA); (N.S.) nonsignificant. (B) Number of colonies formed by E14.5 fetal liver and P10 whole bone marrow cells from Trp53+/+, Trp53ΔCTD/+, Trp53ΔCTD/ΔCTD, and Trp53−/− animals cultivated on methylcellulose-based medium. Colonies originating from three types of progenitors were counted: erythroid progenitors (burst-forming unit-erythroid [BFU-E]), granulocyte and macrophage progenitors (colony-forming unit-granulocyte and macrophage [CFU-GM]), and multipotential granulocyte, erythroid, macrophage, and megakaryocyte progenitors (CFU-granulocyte, erythroid, macrophage, and megakaryocyte [CFU-GEMM]). (C) The percentage survival of lethally irradiated mice of mixed genetic background (BL6/129Sv) transplanted with E14.5 fetal liver cells from matching BL6/129Sv Trp53+/+, Trp53ΔCTD/+, and Trp53ΔCTD/ΔCTD embryos shows the decreased ability of ΔCTD/ΔCTD cells to recolonize the recipient bone marrow. Animals receiving no transplant were used as negative control. (D) Relative expression of two transcription factors essential for hematopoiesis (Gfi1 and Gfi1b) in P10 livers, bone marrow, spleens, and thymi from Trp53+/+, Trp53ΔCTD/+, Trp53ΔCTD/ΔCTD, and Trp53−/− animals by qRT–PCR reveals impaired activity for the p53ΔCTD mutant. Expression is normalized to Gapdh. In all panels, n = 5; bars indicate SEM; (*) P < 0.05; (**) P < 0.01 (Student's t-test).
Figure 5.
Figure 5.
Deletion of the C-terminal 24 amino acids from p53 induces senescence in bone marrow cells. (A) Quantitative assay of SA-β-Gal activity in P10 bone marrow cells from Trp53+/+, Trp53ΔCTD/+, Trp53ΔCTD/ΔCTD, and Trp53−/− animals reveals a marked increase in senescent cells in the mutant bone marrow. n = 5; bars indicate SEM; (***) P < 0.001 (Student's t-test). (B) Representative pictures of A. (C) Relative expression of several senescence markers in P10 whole bone marrow from Trp53+/+, Trp53ΔCTD/+, Trp53ΔCTD/ΔCTD, and Trp53−/− animals by qRT–PCR. The p53 direct target gene Cdkn1a (p21) is a bona fide senescence marker and is up-regulated in ΔCTD/ΔCTD bone marrow. Cdkn2b but not the two transcripts encoded by Cdkn2a is significantly up-regulated in the ΔCTD/ΔCTD bone marrow. Expression is normalized to Gapdh. In all panels, n = 5; bars indicate SEM; (*) P < 0.05; (**) P < 0.01 (Student's t-test); (N.S.) nonsignificant. (D) Whole bone marrow cells from P10 animals of the genotypes Trp53+/+, Trp53ΔCTD/+, Trp53ΔCTD/ΔCTD, and Trp53−/− stained with an activated caspase 3 antibody, a bona fide marker for apoptotic cells, did not show enhanced apoptosis. Insets represent MEFs derived from E14.5 Trp53+/+, Trp53ΔCTD/ΔCTD, and Trp53−/− embryos and treated with the DNA-damaging agent DOX at 0.2 μg/mL. Twenty-four hours after treatment, cells were fixed and stained with an anti-activated caspase 3. Unlike p53−/− cells, p53ΔCTD/ΔCTD MEFs are capable of undergoing apoptosis after DNA damage to the same extent as p53+/+ or p53ΔCTD/+ MEFs.
Figure 6.
Figure 6.
The C-terminal domain is a negative regulator of p53 activity in the thymus. (A) Relative expression of five p53 direct target genes in P10 thymi from Trp53+/+, Trp53ΔCTD/+, Trp53ΔCTD/ΔCTD, and Trp53−/− animals by qRT–PCR demonstrates tissue-specific up-regulation of the two proapoptotic targets Bbc3 (Puma) and Pmaip1 (Noxa). Expression is normalized to Gapdh. In all panels, n = 5; bars indicate SEM; (*) P < 0.05 (Student's t-test). (B, top) Immunoblot shows comparable p53 expression between the wild-type and mutant thymi at P10. p21 expression is not changed, whereas Puma protein levels are increased in the mutant thymus. β-Actin was used as the loading control. (Bottom) Quantitation of p53 levels (relative intensity of p53 bands vs. actin bands), n = 5; bars indicate SEM; (P) Student's t-test; (N.S.) nonsignificant. (C) P10 Trp53ΔCTD/ΔCTD thymi display reduced size and cellularity but no difference in basal p53 levels, as assessed by H&E staining and IHC, respectively. Bar, 200 μm. (D) ChIP on P10 thymus protein extracts followed by qPCR demonstrates enhanced binding of p53ΔCTD on its response elements within Bbc3 (Puma) and Pmaip1 (Noxa) genes.
Figure 7.
Figure 7.
Hyperactive p53 lacking the C-terminal domain induces apoptosis but not senescence in thymocytes. (A) IHC on thymus sections from P10 Trp53+/+, Trp53ΔCTD/+, and Trp53ΔCTD/ΔCTD animals reveals a significant increase of activated caspase 3 staining in the mutant thymus. Black arrowheads show activated caspase 3-positive cells. (B) SA-β-Gal activity in P10 thymocytes isolated from Trp53+/+, Trp53ΔCTD/+, and Trp53ΔCTD/ΔCTD animals reveals no difference in the number of senescent cells between wild-type, heterozygous, or homozygous mutant thymi.
Figure 8.
Figure 8.
In the liver, p53 lacking the C-terminal domain is expressed at wild-type levels but is defective in gene expression. (A) Relative expression of five p53 direct target genes in P10 livers from Trp53+/+, Trp53ΔCTD/+, Trp53ΔCTD/ΔCTD, and Trp53−/− animals by qRT–PCR demonstrates tissue-specific down-regulation of all targets except p21. Expression is normalized to Gapdh. In all panels, n = 5; bars indicate SEM; (*) P < 0.05; (**) P < 0.01; (***) P < 0.001; (N.S) nonsignificant (Student's t-test). (B, top) Immunoblot shows comparable p53 expression between wild-type and mutant livers at P10. β-Actin was used as the loading control. (Bottom) Quantitation of p53 levels (relative intensity of p53 bands vs. actin bands); n = 5; bars indicate SEM; (P) Student's t-test; (N.S.) nonsignificant. (C) P10 Trp53+/+ and Trp53ΔCTD/ΔCTD livers display comparable size and cellularity and no difference in basal p53 levels, as assessed by H&E staining and IHC, respectively. Bar, 200 μm. (D) ChIP on P10 liver protein extracts followed by qPCR. In all panels, n = 4; bars indicate SEM; (*) P < 0.05; (**) P < 0.01; (N.S.) nonsignificant (Student's t-test).
Figure 9.
Figure 9.
In the spleen, p53 lacking the C-terminal domain is overexpressed and hyperactive in a target gene-selective manner. (A) Relative expression of five p53 direct target genes in P10 spleens from Trp53+/+, Trp53ΔCTD/+, Trp53ΔCTD/ΔCTD, and Trp53−/− animals by qRT–PCR demonstrates target-specific regulation. Expression is normalized to Gapdh. In all panels, n = 5; bars indicate SEM; (*) P < 0.05; (***) P < 0.001; (N.S.) nonsignificant (Student's t-test). (B, top) Immunoblot shows increased p53 expression in the mutant spleen compared with wild type at P10. β-Actin was used as the loading control. (Bottom) Quantitation of p53 levels (relative intensity of p53 bands vs. actin bands); n = 5; bars indicate SEM; (***) P < 0.001 (Student's t-test). (C) Histology of the spleen of P10 animals shows no difference between Trp53+/+ and Trp53ΔCTD/+ organs but reduced size and cellularity in Trp53ΔCTD/ΔCTD animals. IHC on the same tissues reveals a significant and dose-dependent increase of p53 protein expression. Bar, 200 μm. (D, top) SA-β-Gal activity in P10 splenocytes isolated from Trp53+/+, Trp53ΔCTD/+, and Trp53ΔCTD/ΔCTD animals reveals no difference in senescent cell numbers between wild-type, heterozygous, or mutant thymi. (Bottom) IHC on spleen sections from P10 Trp53+/+, Trp53ΔCTD/+, and Trp53ΔCTD/ΔCTD animals reveals no significant increase of activated caspase 3 staining in the mutant spleen.

Similar articles

Cited by

References

    1. Abbas HA, Maccio DR, Coskun S, Jackson JG, Hazen AL, Sills TM, You MJ, Hirschi KK, Lozano G 2010. Mdm2 is required for survival of hematopoietic stem cells/progenitors via dampening of ROS-induced p53 activity. Cell Stem Cell 7: 606–617 - PMC - PubMed
    1. Ahn J, Prives C 2001. The C-terminus of p53: The more you learn the less you know. Nat Struct Biol 8: 730–732 - PubMed
    1. Anderson ME, Woelker B, Reed M, Wang P, Tegtmeyer P 1997. Reciprocal interference between the sequence-specific core and nonspecific C-terminal DNA binding domains of p53: Implications for regulation. Mol Cell Biol 17: 6255–6264 - PMC - PubMed
    1. Armstrong JF, Kaufman MH, Harrison DJ, Clarke AR 1995. High-frequency developmental abnormalities in p53-deficient mice. Curr Biol 5: 931–936 - PubMed
    1. Barlev NA, Liu L, Chehab NH, Mansfield K, Harris KG, Halazonetis TD, Berger SL 2001. Acetylation of p53 activates transcription through recruitment of coactivators/histone acetyltransferases. Mol Cell 8: 1243–1254 - PubMed

Publication types

MeSH terms

Substances