. 2013 Sep 1;27(17):1932-46.
doi: 10.1101/gad.220244.113.

Mutually exclusive signaling signatures define the hepatic and pancreatic progenitor cell lineage divergence

Affiliations

Mutually exclusive signaling signatures define the hepatic and pancreatic progenitor cell lineage divergence

Elisa Rodríguez-Seguel et al. Genes Dev. .

Abstract

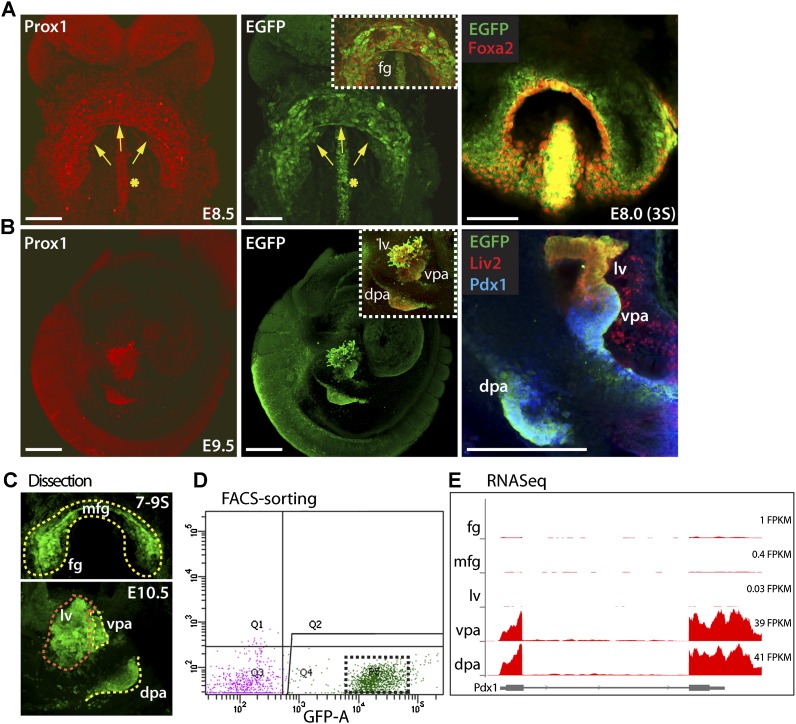
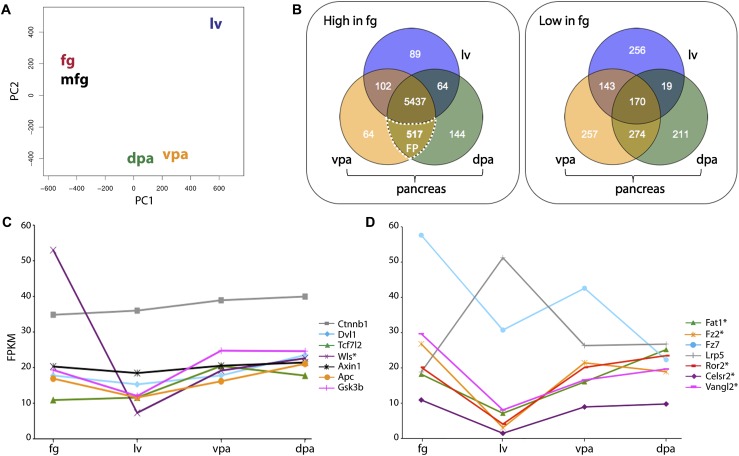
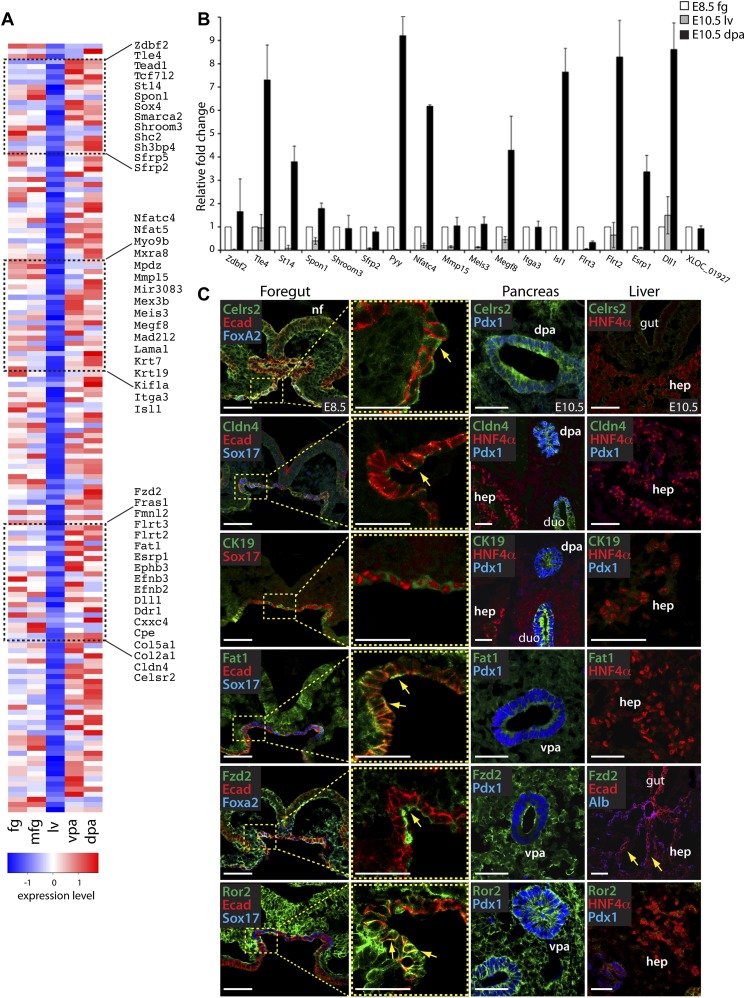
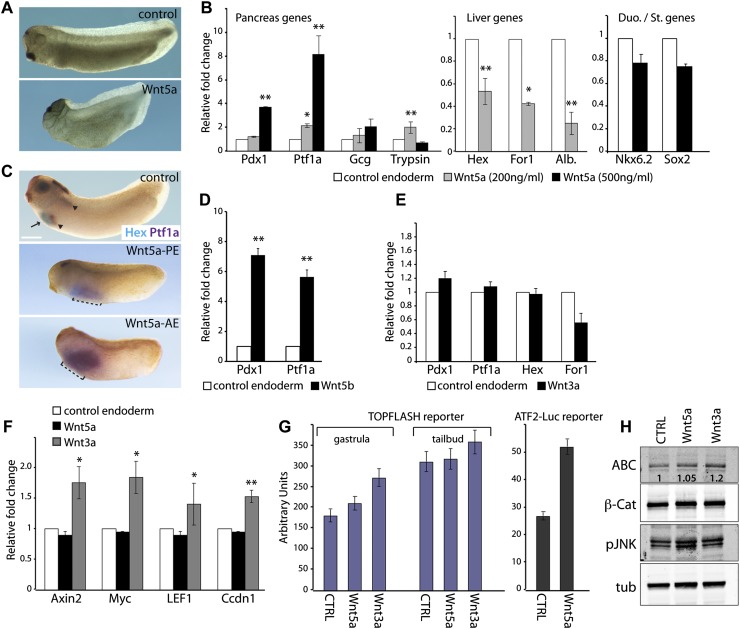
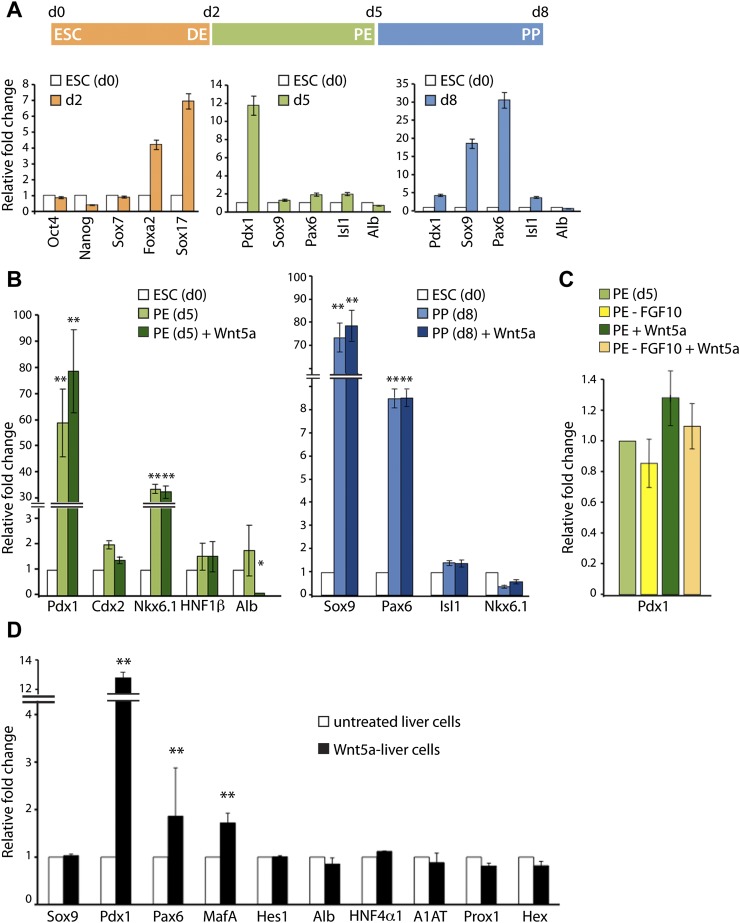
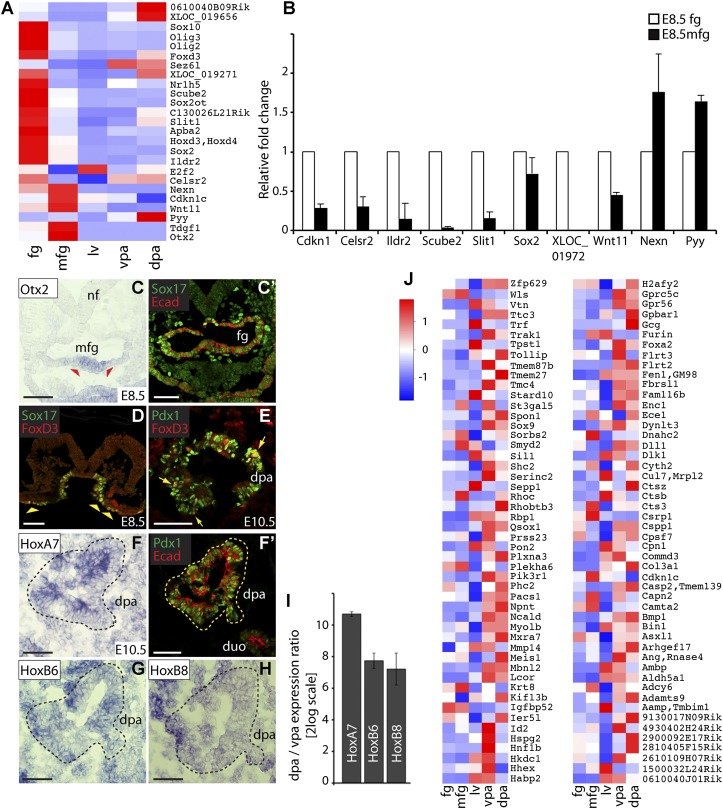
Understanding how distinct cell types arise from multipotent progenitor cells is a major quest in stem cell biology. The liver and pancreas share many aspects of their early development and possibly originate from a common progenitor. However, how liver and pancreas cells diverge from a common endoderm progenitor population and adopt specific fates remains elusive. Using RNA sequencing (RNA-seq), we defined the molecular identity of liver and pancreas progenitors that were isolated from the mouse embryo at two time points, spanning the period when the lineage decision is made. The integration of temporal and spatial gene expression profiles unveiled mutually exclusive signaling signatures in hepatic and pancreatic progenitors. Importantly, we identified the noncanonical Wnt pathway as a potential developmental regulator of this fate decision and capable of inducing the pancreas program in endoderm and liver cells. Our study offers an unprecedented view of gene expression programs in liver and pancreas progenitors and forms the basis for formulating lineage-reprogramming strategies to convert adult hepatic cells into pancreatic cells.

Keywords: RNA-seq; Wnt signaling; liver; mouse; pancreas.


Figures

Figure 1.
Figure 1.
In vivo isolation and RNA-seq profiling of endoderm progenitor cells from Tg(Prox1-EGFP) mouse embryos. (A) Representative maximum confocal Z-projections of immunofluorescence analysis in Tg(Prox1-EGFP) E8.5 mouse embryos shows EGFP reporter expression in both ventral (arrows) and dorsal (asterisk) foregut cells, mirroring endogenous Prox1 expression (see the inset for overlay) and overlapping with Foxa2 expression domains at the three-somite (3S) stage. Embryos are presented in ventral view. (B) In Tg(Prox1-EGFP) E9.5 mouse embryos, EGFP expression was detected in the hepatic and both dorsal and ventral pancreatic buds, mirroring the endogenous Prox1 (see the inset for overlay). EGFP colocalized with Pdx1 in both pancreatic buds and with Liv2 solely in the liver bud. Embryos are presented in lateral view. (C–E) Schematic representation of cell sampling and the RNA-seq procedure. (C) EGFP+ fg and mfg endoderm at the seven- to nine-somite (7–9S) stage/E8.5 and liver (lv), ventral (vpa), and dorsal (dpa) pancreas at E10.5 were microdissected from Tg(Prox1-EGFP) embryos. Cells were dissociated and subjected to FACS. (D) Representative diagram of the EGFP+ cell fraction isolated by FACS. The dashed box indicates EGFP+-gated cells, and cells negative for EGFP are in purple. Transcript expression was profiled by RNA-seq. (E) Example illustrating the RNA-seq read coverage profile of the pancreatic-specific gene Pdx1. The Y-axis indicates the number of read counts in each cell population (Y-axis scale is 0 1000 counts). FPKM (fragments per kilobase of exon per million fragments mapped) values for Pdx1 in each data set are included on the right. Exons are depicted as gray boxes at the bottom on the X-axis. As expected, a large number of reads was found in pancreatic progenitors. Bars: A, 100 μm; B, 50 μm.
Figure 2.
Figure 2.
Temporal and spatial integration analysis of the RNA-seq-derived transcriptome profiles. (A) PCA shows that the RNA-seq-derived transcriptome profiles are characteristic of different progenitor cell types (for detailed description, see the Materials and Methods). (B) Venn diagrams showing the number of unique and common highly expressed transcripts between progenitor cells at different developmental stages. To further focus our analysis on subsets of genes with distinct expression patterns, we divided the working data set into two groups based on a cutoff for high expression (defined as FPKM = 10, at approximately the 50th percentile of RNA-seq expression for each sample). Of 14,053 genes, 8110 could be categorized in the defined Venn regions. For example, 5437 genes exhibited relative abundance values of >10 FPKM in all samples, while 517 genes were highly expressed in the foregut, vpa, and dpa but not in the liver (referred to as group FP). In contrast, 89 genes were highly expressed in the foregut and liver but not in the vpa and dpa. Three-hundred-sixty-three transcripts were present (>10 FPKM) only in the fg but not in the liver, dpa, and vpa (not shown in the diagram). As shown in the PCA plot in A, fg and mfg were highly similar; therefore, these samples were combined together as “foregut” to simplify the visualization. (C,D) Levels of Wnt signaling pathway gene expression across the fg, liver (lv), vpa, and dpa progenitors. FPKM values (Y-axis) were plotted against the different progenitors cell types (X-axis). (*) Wnt factors present in the 150 FP group transcripts that showed significant differential regulation between the pancreas and liver.
Figure 3.
Figure 3.
Analysis of candidate regulators of the pancreatic versus hepatic fate decision. (A) Heat map view of the FP group transcripts that were differentially expressed between any of two samples (150 transcripts out of 517; Cufflinks, P-value < 0.05). Colors represent high (red) or low (blue) expression values based on Z-score normalized FPKM values for each gene. White represents the average between red (high) and blue (low) expression values. Dashed boxes highlight gene sets validated by either RT-qPCR or immunofluorescence analyses. (B) RT-qPCR validation of a subset of differentially expressed genes of the FP group. Data were normalized to that of succinate dehydrogenase (SDHA) and are represented as fold change compared with the E8.5 foregut sample (set to 1 as calibrator). Error bars represent ±SEM. (C) Immunofluorescence analysis validated the exclusive localization of Celrs2, Claudin 4 (Cldn4), CK19, Fat1, Fzd2, and Ror2 in E8.5 foregut endoderm (see arrows in the insets) and pancreatic progenitors and their absence in the liver (see arrows). Micrographs show cross-sections of E8.5 and E10.5 mouse embryos. Bars, 50 μm. (duo) Duodenum; (hep) hepatic progenitors; (lv) liver; (nf) neural folds.
Figure 4.
Figure 4.
Noncanonical Wnt5a activity promotes pancreatic versus hepatic fate in the anterior endoderm. (A) Xenopus embryos injected with Wnt5a mRNA showed a shortened and mildly bent body at the tailbud stage, as previously described (Kim et al. 2005). (B) Endodermal explants were cultured in the presence of Wnt5a recombinant protein from stage 10, collected at the tadpole stage, and assayed for expression of the indicated pancreatic, hepatic, and duodenum/stomach genes by RT-qPCR analysis. Untreated anterior endodermal explants were used as control. Data were normalized to that of ornithine decarboxylase (ODC) and are represented as fold changes compared with untreated endoderm sample (set to 1 as calibrator). Error bars represent ±SEM. (C) Whole-mount double in situ hybridization analysis of Hex (light blue) and Ptf1a (purple) in control and Wnt5a-injected Xenopus embryos at the tadpole stage. The arrow indicates Hex expression in the liver bud, and arrowheads indicate Ptf1a expression in the two pancreatic buds (dorsal and ventral buds). Dashed lines mark expanded Ptf1a expression in the injected embryos. Total number of injected embryos = 61; 41% showed visible expansion of Ptf1a. (AE) Anterior endoderm; (PE) posterior endoderm. (D) RT-qPCR analysis of endodermal explants treated with Wnt5b (200 ng/mL) recombinant protein. Data were normalized to that of ODC and are represented as fold changes compared with untreated endoderm sample (set to 1 as calibrator). (E) RT-qPCR analysis of endodermal explants treated with 500 ng/mL Wnt3a recombinant protein. Data were normalized to that of ODC and are represented as fold changes compared with untreated endoderm sample (set to 1 as calibrator). (F) RT-qPCR analysis of direct downstream target genes of the Wnt/β-catenin pathway in endodermal explants treated with 500 ng/mL Wnt5a or 500 ng/mL Wnt3a recombinant protein. Data were normalized to that of ODC and are represented as fold changes compared with untreated endoderm sample (set to 1 as calibrator). (G) TOPFLASH and ATF2-luc reporter assays in Xenopus embryos. Four-cell stage embryos were injected into the vegetal blastomeres with 50 pg of TOPFLASH or 100 pg of ATF2-luc plus 25 pg of Renilla luciferase reporter plasmids. Endodermal explants were dissected at stage 9 and either left untreated as control (CTRL) or exposed to 500 ng/mL Wnt5a or 500 ng/mL Wnt3a recombinant protein, as indicated. Luciferase reporter assays were carried out in explants lysed at gastrula and early tailbud stages. (H) Western blot analysis of dissected anterior endodermal explants either left untreated as control (CTRL) or exposed to Wnt5a or Wnt3a recombinant protein. The relative ABC/tubulin levels in the treated explants compared with the control, which was set to 1.0, are indicated. (β-cat) Total β-catenin; (tub) α-tubulin. (*) P < 0.05; (**) P < 0.01, as determined by the REST program statistical analysis (Pfaffl et al. 2002).
Figure 5.
Figure 5.
Conserved Wnt5a activity in promoting pancreatic fate. (A) Directed differentiation of mESC monolayer cultures into pancreatic progenitors. RT-qPCR analysis evaluating definitive endoderm (DE), pancreatic endoderm (PE), and pancreatic progenitor (PP) gene expression at different stages of differentiation. Untreated mESCs were used as control (d0). Data were normalized to that of SDHA and are represented as fold changes compared with control (d0) mESCs (set to 1 as calibrator). (B) Day 5 and day 8 mESC cultures were analyzed by RT-qPCR for the expression of the indicated genes following either standard pancreatic endoderm and pancreatic progenitor culture conditions or in the presence of Wnt5a recombinant protein (PE + Wnt5a and PP + Wnt5a). RT-qPCR data were normalized to that of SDHA and are represented as fold changes compared with control (d0) mESCs (set to 1 as calibrator). Error bars represent ±SEM. (C) Day 5 mESC cultures were analyzed by RT-qPCR for the expression of the pancreatic gene Pdx1 following standard pancreatic endoderm culture conditions in the absence of FGF10 (PE − FGF10), the presence of Wnt5a (PE + Wnt5a), or the presence of Wnt5a but without FGF10 (PE − FGF10 + Wnt5a). RT-qPCR data were normalized to that of SDHA and are represented as fold changes compared with standard pancreatic endoderm condition (set to 1 as calibrator). Error bars represent ±SEM. (D) BAML liver cells cultured in the presence of 200 ng/mL Wnt5a for 2 wk were assayed for expression of the indicated pancreatic and hepatic genes by RT-qPCR analysis. Untreated BMAL liver cells were used as control. Data were normalized to that of SDHA and are represented as fold changes compared with untreated liver cells (set to 1 as calibrator). Error bars represent ±SEM. (*) P < 0.05; (**) P < 0.01, as determined by the REST program statistical analysis (Pfaffl et al. 2002). (Alb) Albumin.
Figure 6.
Figure 6.
Identification of distinct spatial patterns within the mouse foregut endoderm. (A) Heat map view of the transcripts that showed significant differential expression between E8.5 fg and mfg (21 transcripts). Colors represent high (red), low (blue), or average (white) expression values based on Z-score-normalized FPKM values for each gene. (B) RT-qPCR validation of a subset of the foregut differentially expressed genes. The XLOC_019271 is not supported by any spliced ESTs or Genscan predictions. By exon junction analysis, we predicted a gene model and validated the expression of this novel transcript in the fg and dpa by RT-qPCR (see also Fig. 3B; Supplemental Fig. 8). Data were normalized to that of SDHA and are represented as fold change compared with the E8.5 fg sample (set to 1 as calibrator). Error bars represent ±SEM. (C–H) Immunofluorescence and in situ hybridization analyses validated the expression of the indicated genes in the E8.5 foregut endoderm (see arrowheads) and/or dorsal pancreatic rudiments (demarcated by dashed line). At E8.5, Otx2 expression was detected in the mfg (C), which coexpressed Sox17 and E-cadherin (Ecad), as shown by immunofluorescence staining on serial section (C′). FoxD3 expression was detected in the E8.5 fg endoderm (D; see arrowheads) and dpa cells at E10.5 (E). Arrows in E indicate FoxD3/Pdx1-double-positive cells. At E10.5, Hox gene expression was detected in the dorsal pancreatic rudiment (F–H), which coexpressed Pdx1 and E-cadherin (Ecad), as shown by immunofluorescence staining on serial section (F′). Bars, 50 μm. (I) RT-qPCR validation of the indicated Hox genes showed differential expression between the vpa and dpa. Data were normalized to that of SDHA and are shown as expression ratio (2-log values) of dpa sample versus vpa sample. Error bars represent ±SEM. (J) The heat map shows the expression of 100 mouse genes found to be expressed in both the vpa and dpa (>10 FPKM) and whose human orthologs are also expressed in human pancreatic “progenitor-like” cells (Micallef et al. 2012).

Similar articles

Cited by

References

    1. Adamidi C, Wang Y, Gruen D, Mastrobuoni G, You X, Tolle D, Dodt M, Mackowiak S, Gogol-Doering A, Oenal P, et al. 2011. De novo assembly and validation of planaria transcriptome by massive parallel sequencing and shotgun proteomics. Genome Res 21: 1193–1200 - PMC - PubMed
    1. Alexa A, Rahnenführer J, Lengauer T 2006. Improved scoring of functional groups from gene expression data by decorrelating GO graph structure. Bioinformatics 22: 1600–1607 - PubMed
    1. Angers S, Moon R 2009. Proximal events in Wnt signal transduction. Nat Rev Mol Cell Biol 10: 468–477 - PubMed
    1. Burke Z, Oliver G 2002. Prox1 is an early specific marker for the developing liver and pancreas in the mammalian foregut endoderm. Mech Dev 118: 147–155 - PubMed
    1. Chalmers A, Slack J, Beck C 2000. Regional gene expression in the epithelia of the Xenopus tadpole gut. Mech Dev 96: 125–128 - PubMed

Publication types