

Mechanical properties of DNA-like polymers
- PMID: 24013560
- PMCID: PMC3905893
- DOI: 10.1093/nar/gkt808
Mechanical properties of DNA-like polymers
Abstract
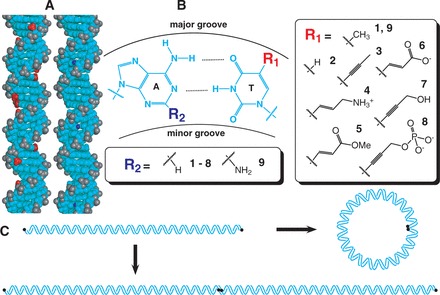
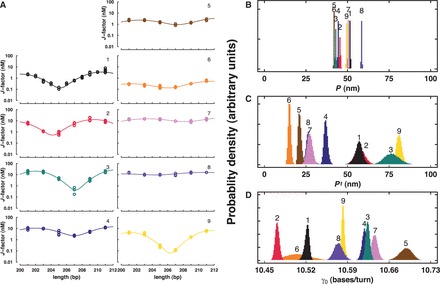
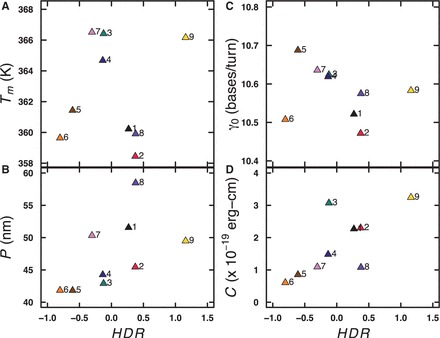
The molecular structure of the DNA double helix has been known for 60 years, but we remain surprisingly ignorant of the balance of forces that determine its mechanical properties. The DNA double helix is among the stiffest of all biopolymers, but neither theory nor experiment has provided a coherent understanding of the relative roles of attractive base stacking forces and repulsive electrostatic forces creating this stiffness. To gain insight, we have created a family of double-helical DNA-like polymers where one of the four normal bases is replaced with various cationic, anionic or neutral analogs. We apply DNA ligase-catalyzed cyclization kinetics experiments to measure the bending and twisting flexibilities of these polymers under low salt conditions. Interestingly, we show that these modifications alter DNA bending stiffness by only 20%, but have much stronger (5-fold) effects on twist flexibility. We suggest that rather than modifying DNA stiffness through a mechanism easily interpretable as electrostatic, the more dominant effect of neutral and charged base modifications is their ability to drive transitions to helical conformations different from canonical B-form DNA.
Figures
 TA
TA CGC
CGC AG
AG T
T ) and LJM-3223 (5'-TGTGAGT
 AGCTCACTCAT
 AG
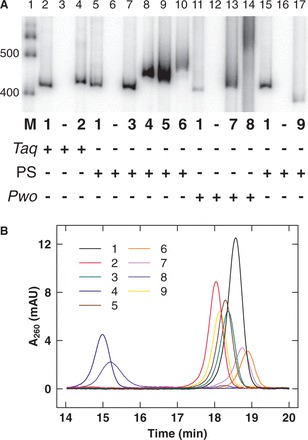
AG ), 0.2 mM each dNTP with indicated analog triphosphate (1–9) completely replacing appropriate dNTP, and 5 U DNA polymerase (indicated with plus symbol) with associated buffer and cycle conditions. Taq DNA polymerase (Taq) conditions: Taq DNA polymerase buffer with 100 mg/ml BSA and 2 mM MgCl
 ; 98°C (3 min), 30 cycles of [94°C (30 s), 60°C (30 s), and 72°C (45 s)], 72°C (5 min). PrimeSTAR HS DNA polymerase (PS) conditions: PrimeSTAR GC buffer with 2 M betaine; 98°C (3 min), 30 cycles of [98°C (15 s), 60°C (5 s), and 72°C (45 s)], 72°C (5 min). Pwo SuperYield DNA Polymerase (Pwo) conditions: Pwo PCR buffer with GC-rich solution and 2 M betaine; 98°C (3 min), 30 cycles of [98°C (1 min), 60°C (2 min), and 72°C (8 min)], 72°C (5 min). Lane 1 is marker (M) DNA (100 bp DNA ladder, Invitrogen) with 400 - and 500-bp bands indicated. (B) Anion exchange chromatography of 98-bp DNA-like polymers (pJ1923). Following equilibration in 20 mM Tris–HCl, pH 8 (buffer A), samples were eluted over 25 min at a 1 ml/min flow rate in a linear gradient from 50 to 100% buffer B (buffer A plus 1 M NaCl). Eluent absorbance at 260 nm (milli-absorbance units) was monitored with elution time (min).
Similar articles
-
Mechanical properties of base-modified DNA are not strictly determined by base stacking or electrostatic interactions.Biophys J. 2014 Jul 15;107(2):448-459. doi: 10.1016/j.bpj.2014.04.066. Biophys J. 2014. PMID: 25028886 Free PMC article.
-
Probing the salt dependence of the torsional stiffness of DNA by multiplexed magnetic torque tweezers.Nucleic Acids Res. 2017 Jun 2;45(10):5920-5929. doi: 10.1093/nar/gkx280. Nucleic Acids Res. 2017. PMID: 28460037 Free PMC article.
-
Electrostatic free energy of the DNA double helix in counterion condensation theory.Biophys Chem. 2002 Dec 10;101-102:461-73. doi: 10.1016/s0301-4622(02)00162-x. Biophys Chem. 2002. PMID: 12488020
-
Quantum Effects Explain the Twist Angle in the Helical Structure of DNA.Chemphyschem. 2024 Oct 1;25(19):e202400372. doi: 10.1002/cphc.202400372. Epub 2024 Sep 9. Chemphyschem. 2024. PMID: 39250431 Review.
-
DNA condensation by multivalent cations.Biopolymers. 1997;44(3):269-82. doi: 10.1002/(SICI)1097-0282(1997)44:3<269::AID-BIP6>3.0.CO;2-T. Biopolymers. 1997. PMID: 9591479 Review.
Cited by
-
Stretching Wormlike Chains in Narrow Tubes of Arbitrary Cross-Sections.Polymers (Basel). 2019 Dec 10;11(12):2050. doi: 10.3390/polym11122050. Polymers (Basel). 2019. PMID: 31835594 Free PMC article.
-
Nonantibiotic Effects of Fluoroquinolones in Mammalian Cells.J Biol Chem. 2015 Sep 4;290(36):22287-97. doi: 10.1074/jbc.M115.671222. Epub 2015 Jul 23. J Biol Chem. 2015. PMID: 26205818 Free PMC article.
-
Structure-mechanics statistical learning unravels the linkage between local rigidity and global flexibility in nucleic acids.Chem Sci. 2020 Apr 23;11(19):4969-4979. doi: 10.1039/d0sc00480d. Chem Sci. 2020. PMID: 34122953 Free PMC article.
-
The free solution mobility of DNA and other analytes varies as the logarithm of the fractional negative charge.Electrophoresis. 2014 Jul;35(12-13):1855-63. doi: 10.1002/elps.201400040. Epub 2014 Jun 5. Electrophoresis. 2014. PMID: 24648187 Free PMC article.
-
Superanionic DNA: enzymatic synthesis of hypermodified DNA bearing four different anionic substituents at all four nucleobases.Nucleic Acids Res. 2023 Nov 27;51(21):11428-11438. doi: 10.1093/nar/gkad893. Nucleic Acids Res. 2023. PMID: 37870471 Free PMC article.
References
-
- Chen HH, Rau DC, Charney E. The flexibility of alternating dA-dT sequences. J. Biomol. Struct. Dyn. 1985;2:709–719. - PubMed
Publication types
MeSH terms
Substances
Grants and funding
LinkOut - more resources
Full Text Sources
Other Literature Sources
Molecular Biology Databases
