Comparative Study
. 2013 Dec;14(6):843-62.
doi: 10.1007/s10162-013-0412-1. Epub 2013 Sep 7.

Stimulus-frequency otoacoustic emission suppression tuning in humans: comparison to behavioral tuning

Affiliations
Comparative Study

Stimulus-frequency otoacoustic emission suppression tuning in humans: comparison to behavioral tuning

Karolina K Charaziak et al. J Assoc Res Otolaryngol. 2013 Dec.

Abstract

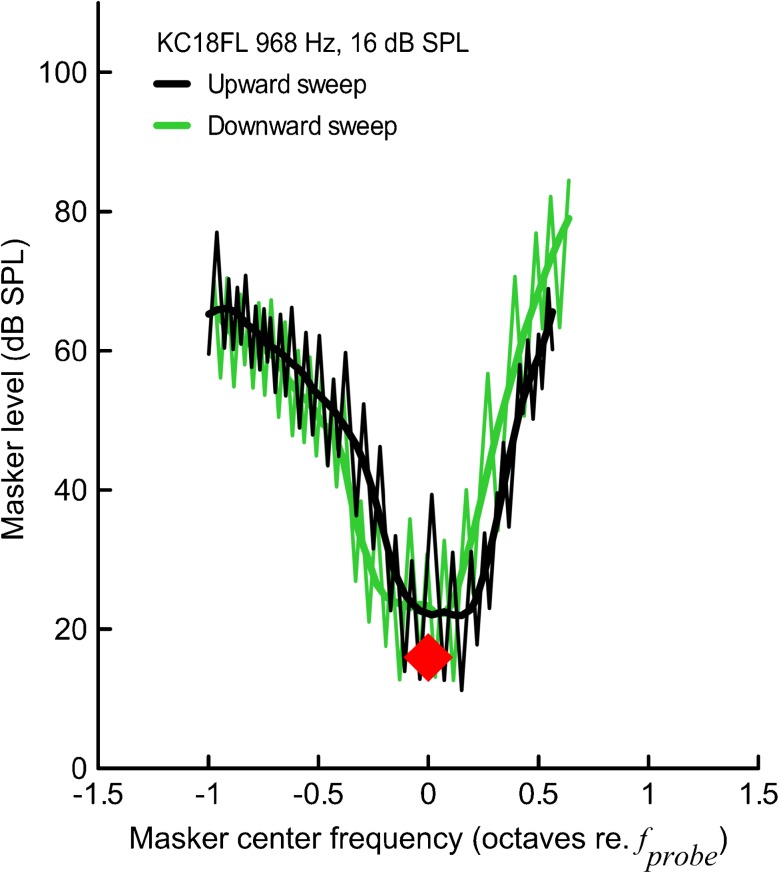
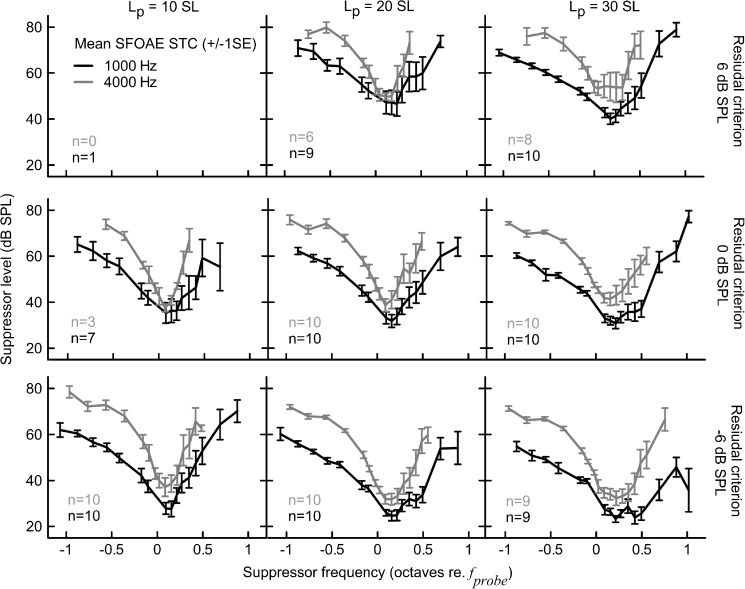
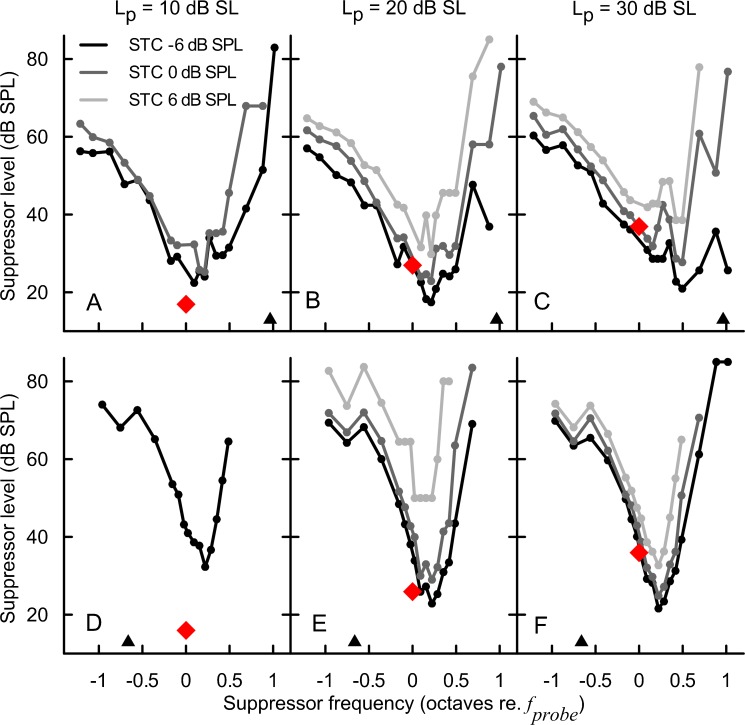
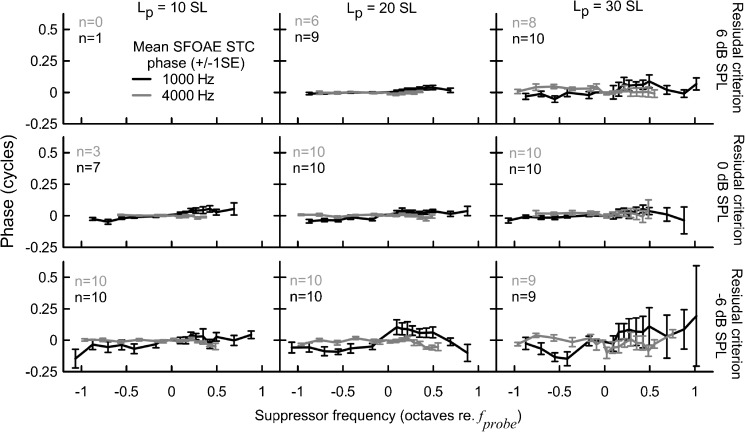
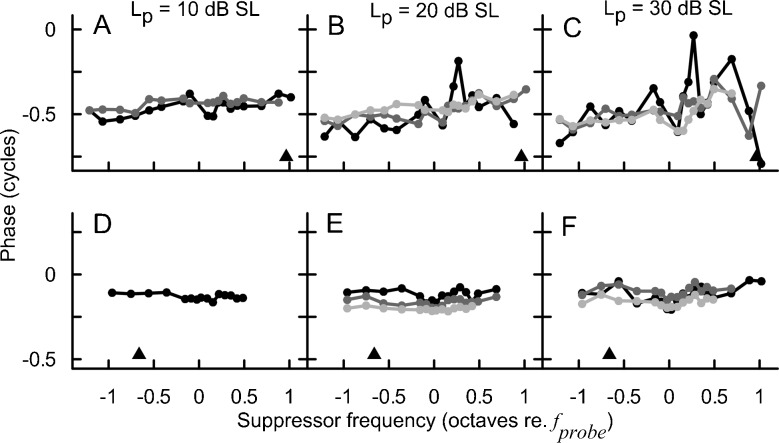
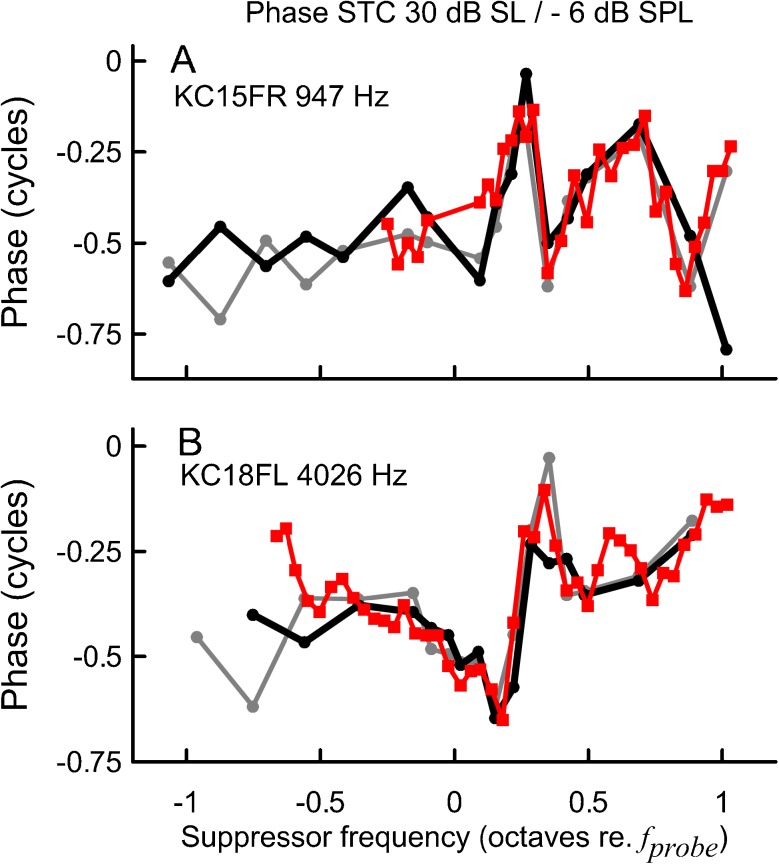
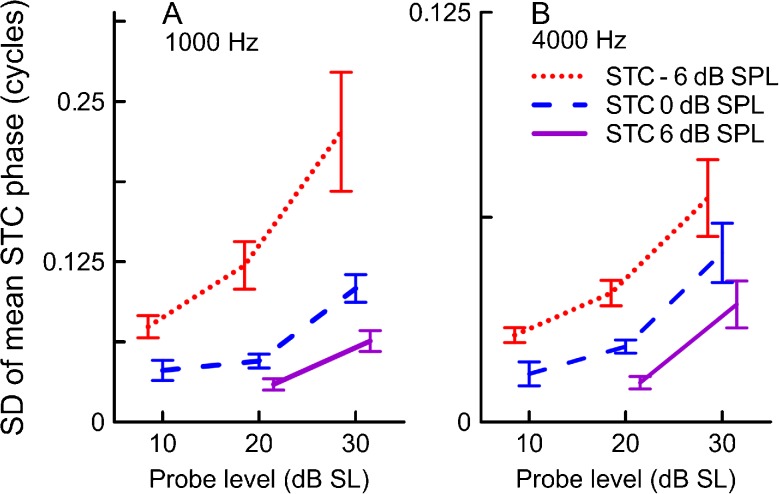
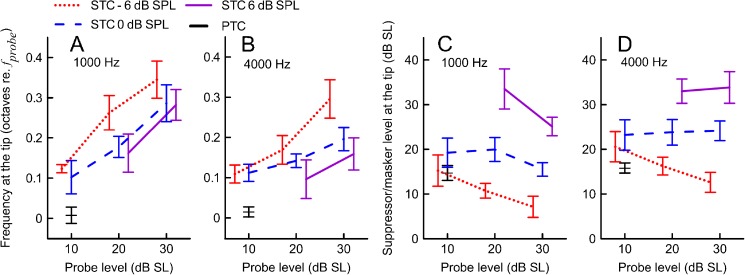
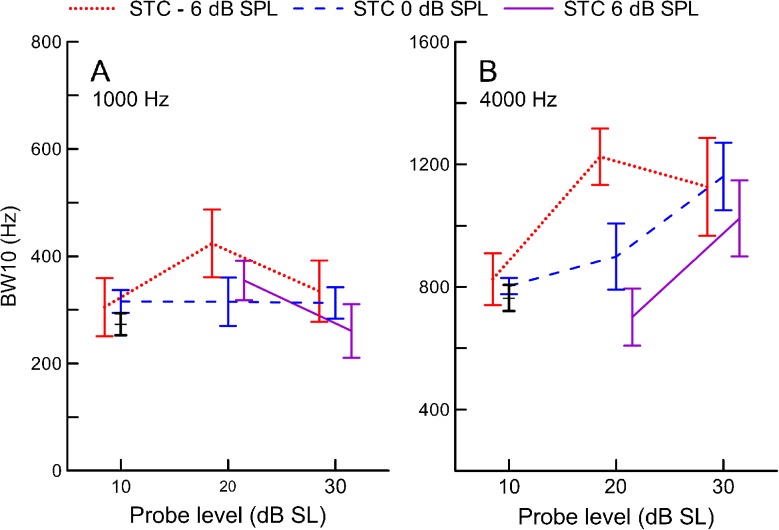
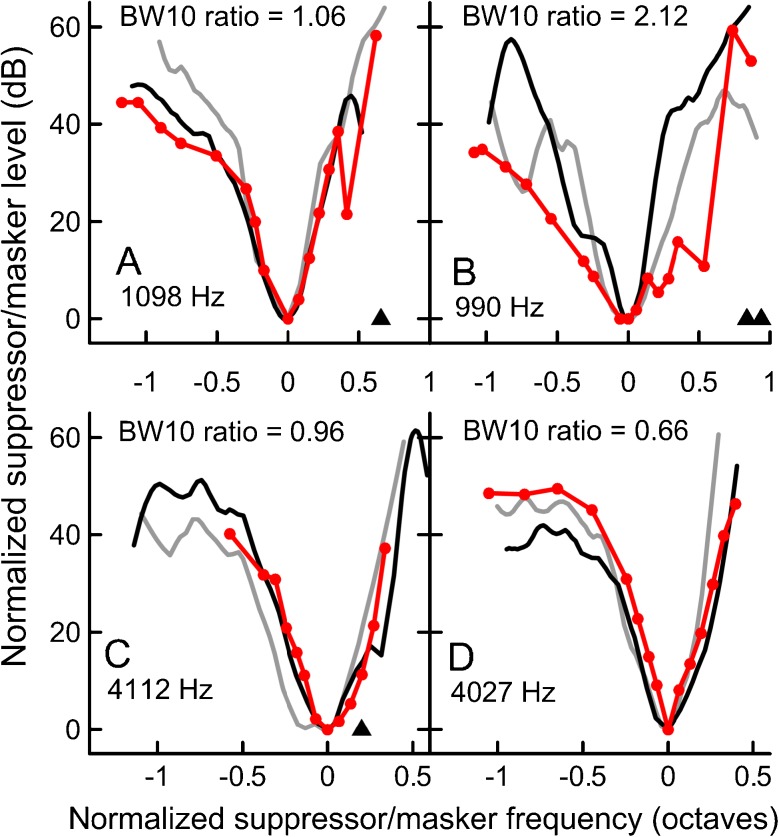
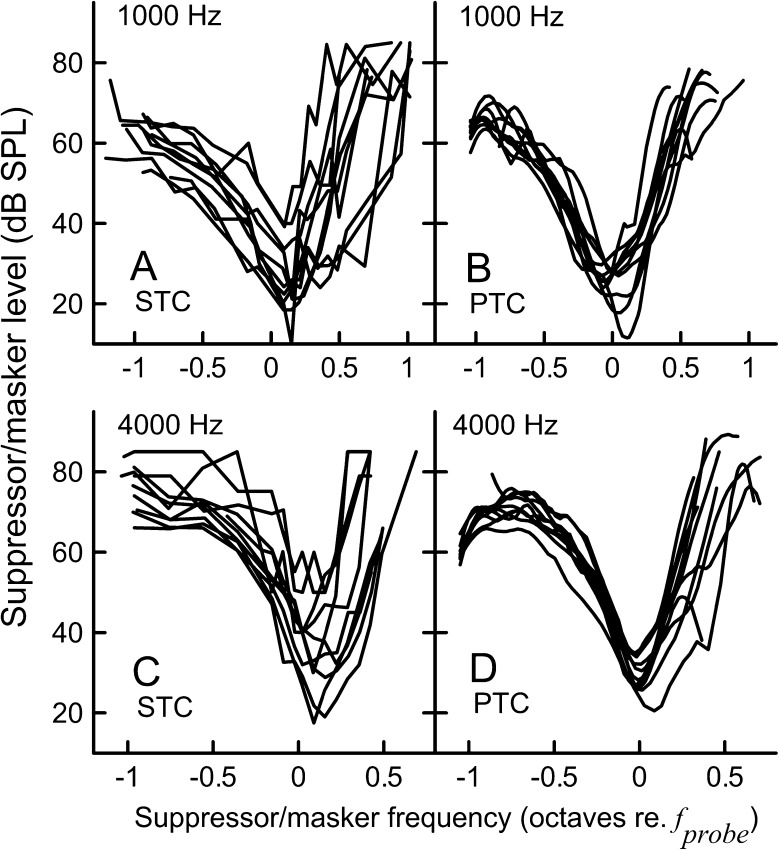
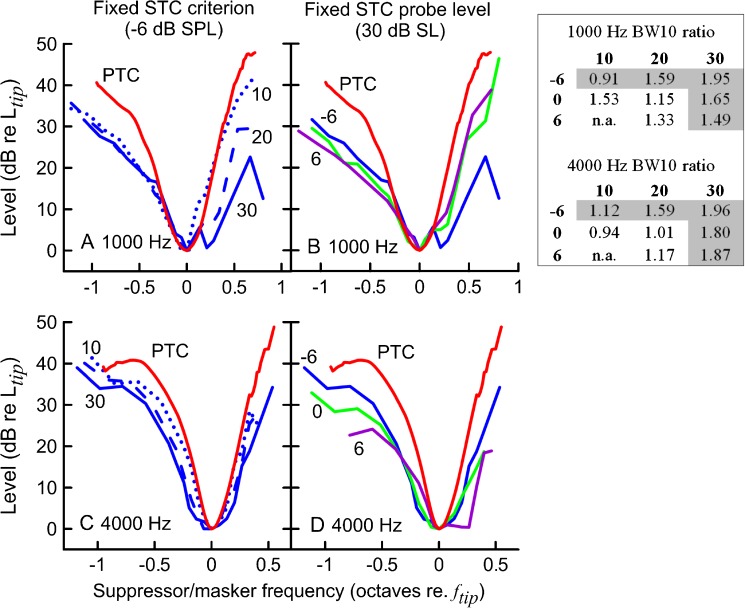
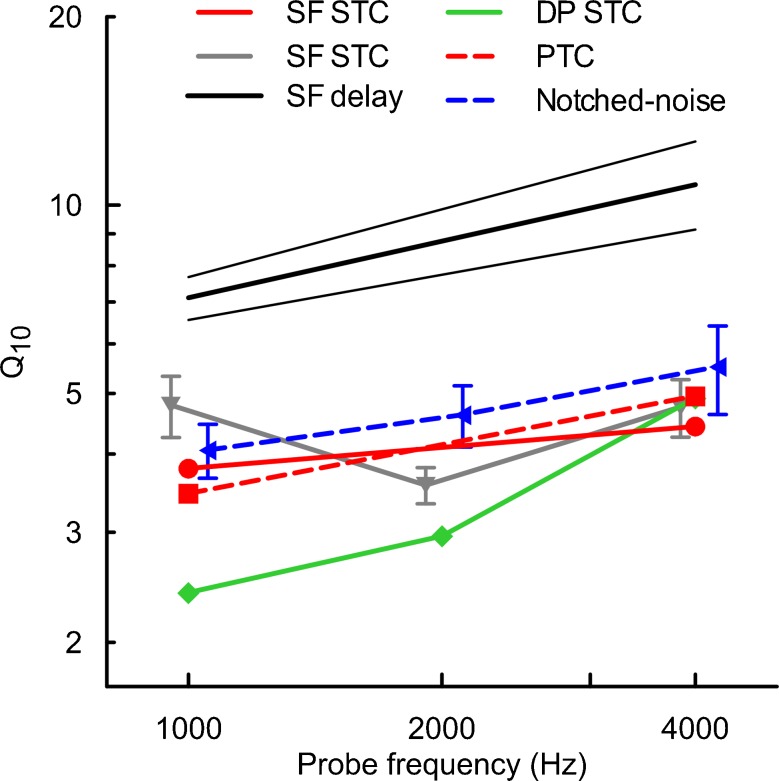
As shown by the work of Kemp and Chum in 1980, stimulus-frequency otoacoustic emission suppression tuning curves (SFOAE STCs) have potential to objectively estimate behaviorally measured tuning curves. To date, this potential has not been tested. This study aims to do so by comparing SFOAE STCs and behavioral measures of tuning (simultaneous masking psychophysical tuning curves, PTCs) in 10 normal-hearing listeners for frequency ranges centered around 1,000 and 4,000 Hz at low probe levels. Additionally, SFOAE STCs were collected for varying conditions (probe level and suppression criterion) to identify the optimal parameters for comparison with behavioral data and to evaluate how these conditions affect the features of SFOAE STCs. SFOAE STCs qualitatively resembled PTCs: they demonstrated band-pass characteristics and asymmetric shapes with steeper high-frequency sides than low, but unlike PTCs they were consistently tuned to frequencies just above the probe frequency. When averaged across subjects the shapes of SFOAE STCs and PTCs showed agreement for most recording conditions, suggesting that PTCs are predominantly shaped by the frequency-selective filtering and suppressive effects of the cochlea. Individual SFOAE STCs often demonstrated irregular shapes (e.g., "double-tips"), particularly for the 1,000-Hz probe, which were not observed for the same subject's PTC. These results show the limited utility of SFOAE STCs to assess tuning in an individual. The irregularly shaped SFOAE STCs may be attributed to contributions from SFOAE sources distributed over a region of the basilar membrane extending beyond the probe characteristic place, as suggested by a repeatable pattern of SFOAE residual phase shifts observed in individual data.


Figures

FIG. 1
FIG. 1
PTCs collected with “fast” method for upward masker sweep (black) and downward masker sweep (green). The raw tracking data are shown with thin lines. To find the level of the masker required to just mask the probe, the raw data were smoothed with the LOESS algorithm with smoothing parameter α set at 0.25 (bold lines). The tonal probe parameters are indicated with a red diamond.
FIG. 2
FIG. 2
Mean SFOAE STC at 1,000 (black) and 4,000 Hz (gray) probe frequencies for 10, 20, and 30 dB SL probe levels (columns) and −6, 0, and 6 dB SPL residual criteria (rows). Error bars denote ±1 standard error (SE). The number (n) of STCs collected for each condition is indicated in each subplot.
FIG. 3
FIG. 3
SFOAE STCs for subject KC15FR at the 947 Hz (AC) and the 4026 Hz probe frequency (DF). The data are grouped in columns according to the probe level (10, 20, and 30 dB SL), and the line color indicates the SFOAE residual criterion: −6 (black), 0 (dark gray), and 6 dB SPL (light gray). The red diamonds denote the probe parameters. The triangles indicate the frequency of the SOAEs.
FIG. 4
FIG. 4
Mean phase of the SFOAE residual at the criterion threshold. Other plot conventions are as in Fig. 2.
FIG. 5
FIG. 5
The SFOAE residual phase curves at the criterion threshold for the STCs shown in Fig. 3. Plotting conventions as in Fig 3.
FIG. 6
FIG. 6
SFOAE STC residual phase for subjects KC15FR at 947 Hz (A) and KC18FL at 4,026 Hz (B). The probe level was fixed at 30 dB SL and the residual criterion at −6 dB SPL. The black and gray solid lines correspond to recordings made with resolution of 15 points/octave around the tip and 5 points/octave at the flanks (see the “Materials and Methods” section for details), and the red lines correspond to recordings made with a resolution of 25 points/octave. Data plotted in gray and red were collected during a retest session (5–8 weeks later).
FIG. 7
FIG. 7
Variation in the SFOAE residual phase at criterion threshold expressed as the standard deviation of the mean unwrapped phase across suppressor frequencies for the 1,000 Hz STCs (A) and the 4,000 Hz STCs (B) as a function of the probe level. Mean values and SE are shown. Red dotted line for STCs collected for the −6 dB SPL criterion, blue dashed line for the 0 dB SPL criterion, and purple solid line for the 6 dB SPL criterion. Note the Y axis scale difference for A and B. Note that probe levels in Figs.7–9 have been offset slightly for clarity.
FIG. 8
FIG. 8
Mean suppressor frequencies and suppressor levels at the tip of SFOAE STCs at 1,000 (A and C) and 4,000 Hz (B and D) as a function of probe level. The mean data for PTCs are shown in black. Error bars denote ±1SE. Other plotting conventions as in Fig. 7.
FIG. 9
FIG. 9
Mean widths of SFOAE STCs at 1,000 (A) and 4,000 Hz (B) expressed as bandwidth 10 dB above tuning curve tip (BW10) as a function of probe level. The mean data for PTCs are shown in black. Error bars denote ±1SE. Other plotting conventions as in Fig. 6.
FIG. 10
FIG. 10
Examples of individual SFOAE STC (in red, circles) and PTC (black—upward masker sweep; gray—downward sweep) fits for 1,000 (A and B) and 4,000 Hz (C and D). The left panels show examples of fits with BW10 ratios close to 1 (“good” agreement in terms of sharpness of tuning), whereas the right panels show examples of relatively poor agreement. All STCs were collected for 10 dB SL/−6 dB SPL condition. For this condition, the BW10 ratios ranged from 0.33 to 2.12 for 1,000 Hz data and from 0.66 to 1.62 for 4,000 Hz data. Triangles denote frequencies of SOAEs, if present.
FIG. 11
FIG. 11
Individual SFOAE STCs (10 dB SL/−6 dB SPL criterion condition) and LOESS-smoothened PTCs (upward sweep) for the 1,000-Hz probe (A and B) and the 4,000-Hz probe (C and D).
FIG. 12
FIG. 12
Average SFOAE STCs (replotted from Fig. 2) and average PTCs for n = 10 (red) for 1,000 (A and B) and 4,000 Hz (B and C) probe tones. In panels A and C, average STCs (in blue) for a fixed residual criterion (−6 dB SPL) and increasing probe level (10 dB SL—dotted lines, 20 dB SL—dashed lines, 30 dB SL—solid lines) are shown. In panels B and D, average STCs for a fixed probe level (30 dB SL) and changing criteria (−6 dB SPL—blue, 0 dB SPL—green, 6 dB SPL—purple) are shown. The tuning curves were normalized to their tip. The table on the left shows ratios of average STC BW10 to corresponding average PTC BW10 across STCs probe levels (columns) and criteria (rows). Note: BW10 ratios were calculated for average curves built for subjects that completed both conditions (for simplicity, average PTC for n = 10 is only shown). The grayed BW10 ratios are for the curves plotted in panels AD.
FIG. 13
FIG. 13
Estimates of the sharpness of tuning in humans derived from different measurement methods, with the solid lines representing objective methods and dashed lines representing the behavioral methods. Symbols represent mean Q10 values (f tip/BW10), and error bars denote ±1SE (if available). The red lines correspond to data from this report (Q10 for mean SFOAE STCs for the 10 dB SL/−6 dB SPL condition and mean PTCs are shown). Black thick line with 95 % CI (thin lines)—sharpness of tuning derived from SFOAE delays measured for a 40 dB SPL probe level (Shera et al. 2002); note: similar results were obtained by Bentsen et al. (2011); gray line with inverted triangles—SFOAE STCs recorded for a 40-dB SPL probe (Keefe et al. 2008); green line with diamonds—DPOAE STCs obtained at 10 dB SL as a function of the f 2 frequency (Gorga et al. 2011); blue line with triangles—simultaneous-masked notched-noise data obtained at 10 dB SL (Oxenham and Shera 2003). The QERB reported in the above reports were converted to Q10 (where Q10 = 0.56QERB). Data are plotted offset along the x axis for clarity.

Similar articles

Cited by

References

    1. Abdala C, Fitzgerald TS. Ipsilateral distortion product otoacoustic emission (2f1-f2) suppression in children with sensorineural hearing loss. J Acoust Soc Am. 2003;114:919–931. - PubMed
    1. Al'tman YA, Nikitin NI. Properties of derived cochlear action potentials in forward tonal masking in guinea pigs. Neurosci Behav Physiol. 2000;30:587–598. - PubMed
    1. Bargones JY, Burns EM. Suppression tuning curves for spontaneous otoacoustic emissions in infants and adults. J Acoust Soc Am. 1988;83:1809–1816. - PubMed
    1. Bentsen T, Harte JM, Dau T. Human cochlear tuning estimates from stimulus-frequency otoacoustic emissions. J Acoust Soc Am. 2011;129:3797–3807. - PubMed
    1. Brass D, Kemp DT. Suppression of stimulus frequency otoacoustic emissions. J Acoust Soc Am. 1993;93:920–939. - PubMed

Publication types

LinkOut - more resources