. 2013;11(8):e1001645.
doi: 10.1371/journal.pbio.1001645. Epub 2013 Aug 27.

The CK2 kinase stabilizes CLOCK and represses its activity in the Drosophila circadian oscillator

Affiliations

The CK2 kinase stabilizes CLOCK and represses its activity in the Drosophila circadian oscillator

Aron Szabó et al. PLoS Biol. 2013.

Abstract

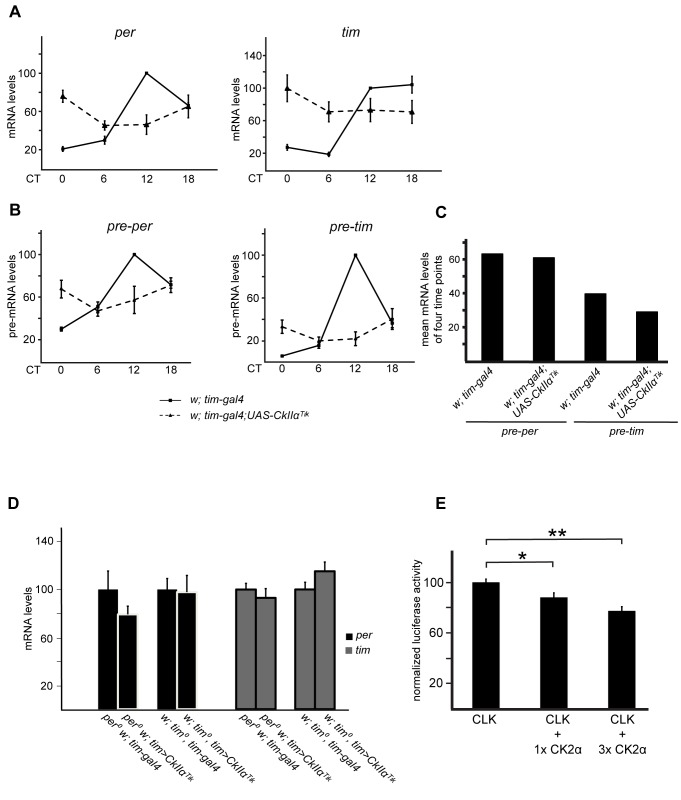
Phosphorylation is a pivotal regulatory mechanism for protein stability and activity in circadian clocks regardless of their evolutionary origin. It determines the speed and strength of molecular oscillations by acting on transcriptional activators and their repressors, which form negative feedback loops. In Drosophila, the CK2 kinase phosphorylates and destabilizes the PERIOD (PER) and TIMELESS (TIM) proteins, which inhibit CLOCK (CLK) transcriptional activity. Here we show that CK2 also targets the CLK activator directly. Downregulating the activity of the catalytic α subunit of CK2 induces CLK degradation, even in the absence of PER and TIM. Unexpectedly, the regulatory β subunit of the CK2 holoenzyme is not required for the regulation of CLK stability. In addition, downregulation of CK2α activity decreases CLK phosphorylation and increases per and tim transcription. These results indicate that CK2 inhibits CLK degradation while reducing its activity. Since the CK1 kinase promotes CLK degradation, we suggest that CLK stability and transcriptional activity result from counteracting effects of CK1 and CK2.


Conflict of interest statement

The authors have declared that no competing interests exist.

Figures

Figure 1
Figure 1. CK2α inhibition triggers CLK degradation.
(A, D) Western blot of sonicated head extracts from flies collected at DD1. Time (h) is indicated as CT. Gray and black bars represent subjective day and subjective night, respectively. A Coomassie Blue (CB) stained band in the size range of CLK is used as a loading control for blots run on 4% gels. Brackets indicate hypo- and hyperphosphorylated forms of CLK. At least two independent experiments were performed for each blot. (A) Two copies of tim-gal4 and two copies of UAS-CkIIαTik transgene were used for the experimental genotype. (B) Quantitative RT-PCR measurements of Clk mRNA levels in heads of flies collected at DD1. Results were averaged from at least four independent experiments. Error bars indicate the s.e.m. Averaged values were normalized to the CT2 control averaged value set to 100. (C) Quantification of CLK immunofluorescence in the PDF-expressing s-LNvs. Fluorescence index is given in arbitrary units. Error bars indicate s.e.m. (D) Flies were entrained and collected at 29°C. One copy of tim-gal4 and two copies of the CkIIα RNAi construct were used for the experimental genotype.
Figure 2
Figure 2. PER and TIM-independent degradation of CLK in CK2αTik overexpressing flies.
(A, B) Western blot of sonicated head extracts from flies collected at DD1. A CB stained band in the size range of CLK is used as a loading control. At least two independent experiments were performed for each blot. (A) Comparison of CLK protein in tim>Tik and control flies in tim0 background. (Left) Comparison between tim>Tik and controls in tim0 background for PER and CLK at CT2. w; tim0 tim-gal4 (tim0 +) and w; tim0 tim-gal4; UAS-CkIIαTik (tim0 CkIIαTik) were used. a and b are different protein extracts from the same genotype at the same time point. We loaded 100 µg of extracts. (Middle) Quantitative RT-PCR measurements of Clk mRNA levels in heads of flies collected at DD1. Results are means of pooled values from two time points (CT2 and 14) with at least two independent samples for each time point. Error bars indicate s.e.m. Average values were normalized to the mean of the control (w; tim0 tim-gal4) set to 100. Previous analysis of separate values at CT2 and CT14 indicated that they were similar (Table S1) justifying their common treatment (see above). (Right) CLK protein/Clk mRNA ratio calculated from mean CT2–CT14 values of Western blot quantification and quantitative RT-PCR data. Ratios were normalized to the control (w; tim0; tim-gal4) set to 100. Abbreviations as in (A). (Right) CLK protein/Clk mRNA ratio calculated from mean CT2–CT14 values of Western blot quantification and quantitative RT-PCR data. Ratios were normalized to the control (w; tim0; tim-gal4) set to 100. (B) Comparison of CLK protein in tim>Tik and control flies in per0 tim0 background. (Left) Genotypes: per0 w; tim0 (per0 tim0) and per0 w; tim0 tim-gal4; UAS-CkIIαTik (per0 tim0 CkIIαTik) as well as w;;ClkJrk. a, b, and c are different protein extracts from the same genotype at the same time point. (Middle) Quantitative RT-PCR measurements of Clk mRNA levels in head extracts of flies collected at CT2. Mean values +/− s.e.m. from at least three independent experiments are shown with the per0 tim0 control set to 100. (Right) CLK protein/Clk mRNA ratio calculated with mean values of Western blot quantification and quantitative RT-PCR data at CT2. Ratios were normalized to the control (per0 tim0) set to 100. (C) Cycloheximide chase of CLK degradation in the presence of CK2α overexpression. per and tim dsRNA was applied to S2 cells prior to transfection. We transfected 1 µg pAc-Clk-V5/His6 with or without 3 µg of the FMO02931 CK2α expression vector. Transfections were split in four equal volumes for the degradation assay. “h in CHX” indicates the hours for which respective cells were incubated in cycloheximide to stop protein synthesis. Immunoreactivity against MHC (myosin heavy chain) was used as loading control. Anti-V5, anti-CK2α, and anti-HA were used to reveal CLK and CK2α, respectively. (Left) Western blots for CLK alone (CLK) and CLK cotransfected with CK2α (CLK+ CK2α). (Right) CK2α expression from the FMO02931 plasmid after 1 d of induction. (Bottom) Average degradation profiles from three independent experiments (as shown on the left). Error bars represent s.e.m.
Figure 3
Figure 3. CK2β does not contribute to the inhibition of CLK degradation.
(A, B) Western blot of nonsonicated head extracts from flies collected at DD1. Gray and black bars represent subjective day and subjective night, respectively. A CB stained band in the size range of CLK is used as a loading control. Brackets indicate hypo- and hyperphosphorylated forms of CLK. At least two independent experiments were performed for each blot. (A) Comparison between tim > CkIIβ RNAi (w; tim-gal4/106845; 32377/+) and tim-gal4/+ controls in a per+ background, for TIM, PER, and CLK proteins. (B) Comparison between tim > CkIIβ RNAi and tim-gal4/+ controls in a per0 background, for TIM and CLK. a and b are different protein extracts from the same genotype at the same time point. (C) Quantitative RT-PCR measurements of Clk mRNA levels in heads of flies collected at DD1. Results shown are means of pooled values from two time points (CT2 and 14, which gave similar values) with two independent samples for each time point. Error bars indicate s.e.m. Average values were normalized to the mean control (per0 w; tim-gal4/+) values set to 100. (D) CLK protein/Clk mRNA ratio calculated from mean CT2–CT14 values of Western blot (B) and quantitative RT-PCR (C) data. Ratios were normalized to the control (per0 w; tim-gal4/+) ratios set to 100.
Figure 4
Figure 4. PER, TIM, and CLK are found in protein complexes containing CK2.
Anti-FLAG immunoprecipitation (IP) from nonsonicated head extracts of flies collected at DD1. FLAG-CK2α or FLAG-CK2β was immunoprecipitated from 1 mg of total protein extracts from heads and 50% of the precipitate was subjected to Western blot analysis. We loaded 50 µg of head extracts as input controls. IgG LC indicates the immunoglobulin G light chain used for the precipitation that is well detected by the anti-mouse secondary antibody. Gray and black bars represent subjective day and subjective night, respectively. Experiments were performed at least twice. (A, Left) FLAG-CK2α was immunoprecipitated from tim >FLAG-CkIIα flies and tim-gal4/+ negative controls (control) in a per+ background. IP of CK2α (FLAG) and co-IP of CK2β, TIM, PER, and CLK were visualized by immunoblotting. «*» shows an aspecific band recognized by the anti-PER antibody. (Right) TIM, PER, and CLK immunoblots of the corresponding inputs on per+ background. The time “CT10” indicates a mixed population of flies harvested at CT8 and CT12. A CB stained band in the size range of CLK is used as a loading control. TIM was run on a 3–8% Tris-Acetate gel. (B, Left) FLAG-CK2β was immunoprecipitated from tim > FLAG-CkIIß flies and tim-gal4/+ negative controls (control) in a per+ background. IP of CK2ß (with anti-CK2ß) and co-IP of CK2α, TIM, PER, and CLK were visualized by immunoblotting. (Right) TIM, PER, and CLK immunoblots of the corresponding inputs. A CB stained band in the size range of CLK is used as a loading control. (C) FLAG-CK2α or FLAG-CK2β was immunoprecipitated from tim >FLAG-CkIIα (α) flies and tim-gal4/+ negative controls (C) in a per0 background. co-IP of CLK was visualized by immunoblotting. Input samples and immunoprecipitates were run on the same gel for C and α. (D) Image showing PDF (green), CK2α (magenta), and CLK (blue) fluorescent immunolabeling in small PDF+ LNv-s of an adult fly at ZT3. The fourth square is a composite picture of the three stainings. Single optical planes are shown taken by confocal microscopy.
Figure 5
Figure 5. CK2α overexpression induces CLK hyperphosphorylation in the presence of PER.
(A, B) Western blot of nonsonicated head extracts from flies collected at DD1. Samples were run on 3–8% Tris-Acetate gels in order to better resolve hyperphosphorylated CLK and TIM forms. Gray and black bars represent subjective day and subjective night, respectively. At least two independent experiments were performed for each blot. (A, Top) Comparison between tim > CkIIα and tim-gal4/+ controls in a per+ background, for TIM, PER, and CLK proteins. (Bottom) Two independent experiments as above were quantified for CLK abundance, and the mean values are plotted. Error bars stand for the difference of the respective values from each experiment and their mean. The value of w; tim-gal4/+at CT0 was normalized to 100. (B) Comparison between per0; tim > CkIIα and per0; tim-gal4/+ controls for CLK. (C) CK2α phosphorylates CLK in vitro. (Top) Wild-type CLK was translated with a N-terminal 6-histidine fusion tag in vitro, affinity purified either in the absence or presence of PER or TIM, and subjected to phosphorylation assays by incubation with γ–32P-ATP either in the absence (−) or presence (+) of CK2α. Intensity of incorporated 32P-phosphate into CLK (32P) was analyzed by autoradiography and total CLK protein levels (CLK) were determined by Western blot analysis. The arrow indicates the position of phosphorylated CLK. (Bottom) Quantification of CLK-incorporated 32P-phosphate after normalization towards total CLK protein levels. Average CLK phosphorylation from at least three experiments ± s.e.m. are shown in the figure with wild-type CLK set to 100.
Figure 6
Figure 6. CK2α decreases CLK transcription factor activity.
(A–D) Quantitative RT-PCR measurements of per, pre–per, tim, and pre–tim mRNA levels in heads of flies collected at DD1. Error bars indicate s.e.m. (A) per and tim mRNA levels in tim>Tik and control flies. Values were normalized to the maximum value (control at CT12) set to 100. Mean mRNA levels +/− s.e.m. from at least three independent experiments are shown. (B) Quantitative RT-PCR measurements of per and tim pre-mRNA levels in heads of tim >Tik and control flies collected at DD1. Average values from three independent experiments were normalized to the control (w; tim-gal4) mean value at CT12 set to 100. Error bars represent s.e.m. (C) Relative qPCR values from Figure 6B were averaged from the four indicated time points (CT0, CT6, CT12, and CT18) for each genotype and for each pre-messenger and the mean value was plotted. 100 stands for the highest pre-mRNA expression in the respective genotype at CT12. (D) per and tim mRNA levels in tim > Tik and controls in a per0 or tim0 background. Results are means of pooled values from two time points (CT2 and 14). Values were normalized to the corresponding controls set to 100. Previous analysis of separate values at CT2 and CT14 indicated that they were similar (Table S1), justifying their common treatment (see above). Average results from at least three independent experiments are shown. (E) Luciferase activity assay in the presence or absence of CK2α overexpression. S2 cells were transfected, harvested, and measured as described in Materials and Methods. We transfected 5 ng pAc-Clk-V5, 10 ng p3x69-luc, and 10 ng pAc-Renilla luciferase with or without 5 or 15 ng of the FMO02931 CK2α expression vector. Mean luciferase activity +/− s.e.m. of at least four different samples from two independent experiments are shown. CLK-dependent luciferase expression in the absence of CK2α co-expression was set to 100. 1× CK2α indicates 5 ng FMO02931, and 3× CK2α stands for 15 ng FMO02931. Student's t test (unpaired, two-tailed) was applied to the respective groups, * p = 0.0315, ** p = 0.00118.

Similar articles

Cited by

References

    1. Kadener S, Stoleru D, McDonald M, Nawathean P, Rosbash M (2007) Clockwork Orange is a transcriptional repressor and a new Drosophila circadian pacemaker component. Genes Dev 21: 1675–1686. - PMC - PubMed
    1. Weber F, Zorn D, Rademacher C, Hung HC (2011) Post-translational timing mechanisms of the Drosophila circadian clock. FEBS Lett 585: 1443–1449. - PubMed
    1. Hardin PE (2011) Molecular genetic analysis of circadian timekeeping in Drosophila. Adv Genet 74: 141–173. - PMC - PubMed
    1. Kloss B, Price JL, Saez L, Blau J, Rothenfluh A, et al. (1998) The Drosophila clock gene double-time encodes a protein closely related to human casein kinase Iepsilon. Cell 94: 97–107. - PubMed
    1. Price JL, Blau J, Rothenfluh A, Abodeely M, Kloss B, et al. (1998) double-time is a novel Drosophila clock gene that regulates PERIOD protein accumulation. Cell 94: 83–95. - PubMed

Publication types