

Mutation in the C-di-AMP cyclase dacA affects fitness and resistance of methicillin resistant Staphylococcus aureus
- PMID: 24013956
- PMCID: PMC3754961
- DOI: 10.1371/journal.pone.0073512
Mutation in the C-di-AMP cyclase dacA affects fitness and resistance of methicillin resistant Staphylococcus aureus
Abstract
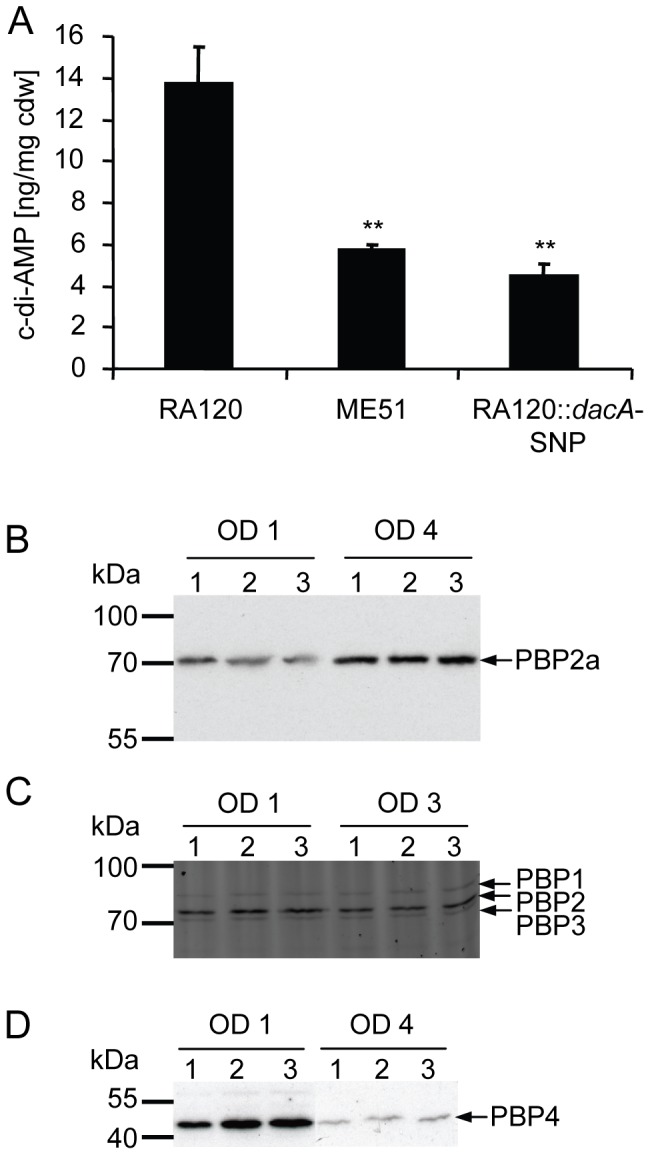
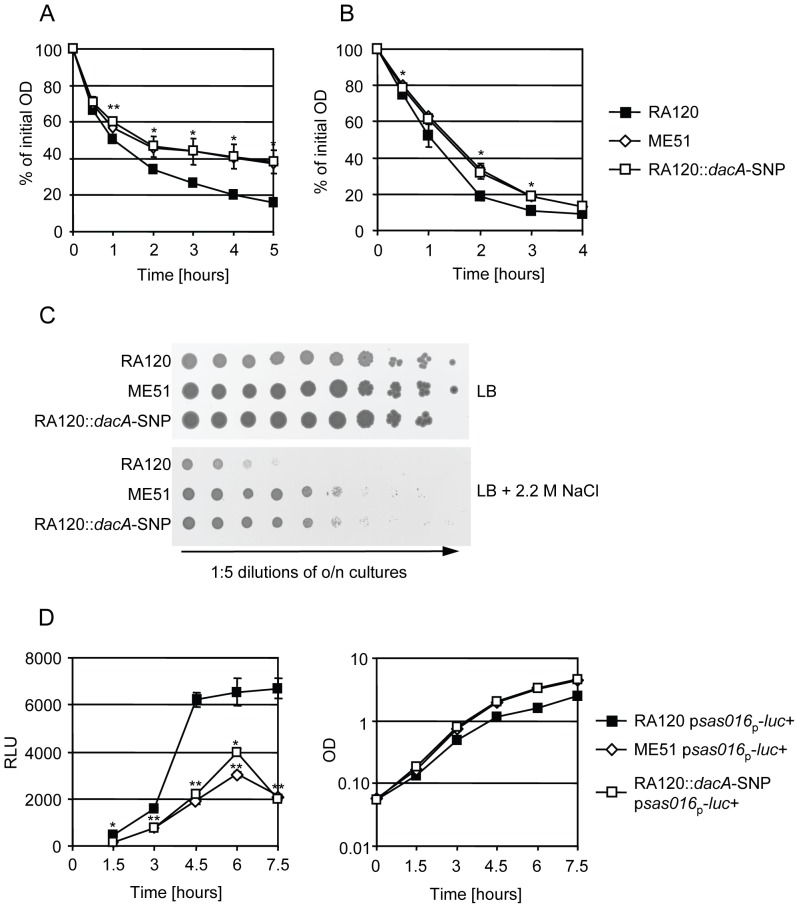
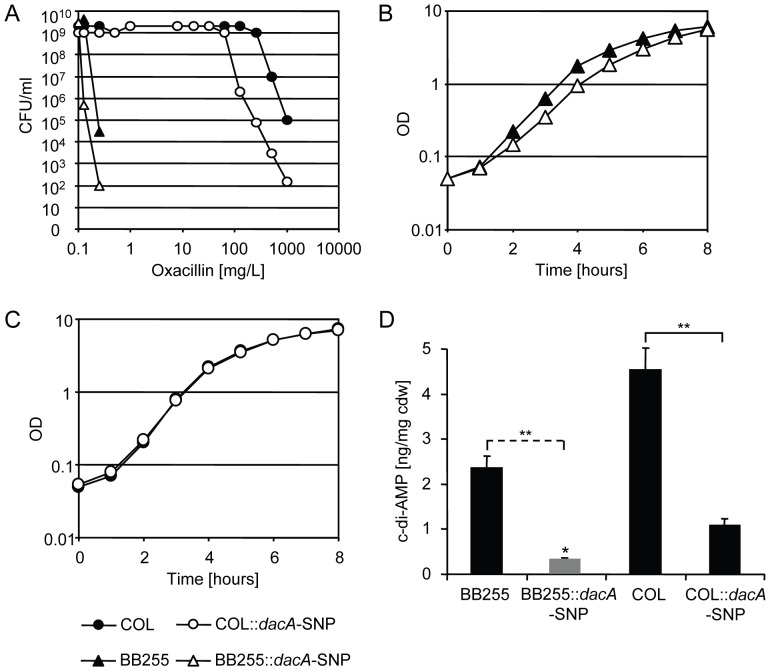
Faster growing and more virulent strains of methicillin resistant Staphylococcus aureus (MRSA) are increasingly displacing highly resistant MRSA. Elevated fitness in these MRSA is often accompanied by decreased and heterogeneous levels of methicillin resistance; however, the mechanisms for this phenomenon are not yet fully understood. Whole genome sequencing was used to investigate the genetic basis of this apparent correlation, in an isogenic MRSA strain pair that differed in methicillin resistance levels and fitness, with respect to growth rate. Sequencing revealed only one single nucleotide polymorphism (SNP) in the diadenylate cyclase gene dacA in the faster growing but less resistant strain. Diadenylate cyclases were recently discovered to synthesize the new second messenger cyclic diadenosine monophosphate (c-di-AMP). Introduction of this mutation into the highly resistant but slower growing strain reduced resistance and increased its growth rate, suggesting a direct connection between the dacA mutation and the phenotypic differences of these strains. Quantification of cellular c-di-AMP revealed that the dacA mutation decreased c-di-AMP levels resulting in reduced autolysis, increased salt tolerance and a reduction in the basal expression of the cell wall stress stimulon. These results indicate that c-di-AMP affects cell envelope-related signalling in S. aureus. The influence of c-di-AMP on growth rate and methicillin resistance in MRSA indicate that altering c-di-AMP levels could be a mechanism by which MRSA strains can increase their fitness levels by reducing their methicillin resistance levels.
Conflict of interest statement
Figures

Similar articles
-
Inhibition of the Staphylococcus aureus c-di-AMP cyclase DacA by direct interaction with the phosphoglucosamine mutase GlmM.PLoS Pathog. 2019 Jan 22;15(1):e1007537. doi: 10.1371/journal.ppat.1007537. eCollection 2019 Jan. PLoS Pathog. 2019. PMID: 30668586 Free PMC article.
-
New Mechanistic Insights into Purine Biosynthesis with Second Messenger c-di-AMP in Relation to Biofilm-Related Persistent Methicillin-Resistant Staphylococcus aureus Infections.mBio. 2021 Dec 21;12(6):e0208121. doi: 10.1128/mBio.02081-21. Epub 2021 Nov 2. mBio. 2021. PMID: 34724823 Free PMC article.
-
c-di-AMP is a new second messenger in Staphylococcus aureus with a role in controlling cell size and envelope stress.PLoS Pathog. 2011 Sep;7(9):e1002217. doi: 10.1371/journal.ppat.1002217. Epub 2011 Sep 1. PLoS Pathog. 2011. PMID: 21909268 Free PMC article.
-
Mycobacterium tuberculosis Rv3586 (DacA) is a diadenylate cyclase that converts ATP or ADP into c-di-AMP.PLoS One. 2012;7(4):e35206. doi: 10.1371/journal.pone.0035206. Epub 2012 Apr 17. PLoS One. 2012. PMID: 22529992 Free PMC article.
-
Replenishing the cyclic-di-AMP pool: regulation of diadenylate cyclase activity in bacteria.Curr Genet. 2016 Nov;62(4):731-738. doi: 10.1007/s00294-016-0600-8. Epub 2016 Apr 13. Curr Genet. 2016. PMID: 27074767 Review.
Cited by
-
Functional mgrA Influences Genetic Changes within a Staphylococcus aureus Cell Population over Time.J Bacteriol. 2022 Oct 18;204(10):e0013822. doi: 10.1128/jb.00138-22. Epub 2022 Sep 26. J Bacteriol. 2022. PMID: 36154359 Free PMC article.
-
Inhibition of the Staphylococcus aureus c-di-AMP cyclase DacA by direct interaction with the phosphoglucosamine mutase GlmM.PLoS Pathog. 2019 Jan 22;15(1):e1007537. doi: 10.1371/journal.ppat.1007537. eCollection 2019 Jan. PLoS Pathog. 2019. PMID: 30668586 Free PMC article.
-
Cyclic di-AMP inhibits Listeria monocytogenes thymineless death during infection.bioRxiv [Preprint]. 2025 May 14:2025.05.14.654034. doi: 10.1101/2025.05.14.654034. bioRxiv. 2025. PMID: 40463240 Free PMC article. Preprint.
-
Thymidine starvation promotes c-di-AMP-dependent inflammation during pathogenic bacterial infection.Cell Host Microbe. 2022 Jul 13;30(7):961-974.e6. doi: 10.1016/j.chom.2022.03.028. Epub 2022 Apr 18. Cell Host Microbe. 2022. PMID: 35439435 Free PMC article.
-
Impact of antibiotics with various target sites on the metabolome of Staphylococcus aureus.Antimicrob Agents Chemother. 2014 Dec;58(12):7151-63. doi: 10.1128/AAC.03104-14. Epub 2014 Sep 15. Antimicrob Agents Chemother. 2014. PMID: 25224006 Free PMC article.
References
-
- Oliveira DC, Tomasz A, de Lencastre H (2002) Secrets of success of a human pathogen: molecular evolution of pandemic clones of meticillin-resistant Staphylococcus aureus . Lancet Infect Dis 2: 180–189. - PubMed
-
- Mediavilla JR, Chen L, Mathema B, Kreiswirth BN (2012) Global epidemiology of community-associated methicillin resistant Staphylococcus aureus (CA-MRSA). Curr Opin Microbiol 15: 588–595. - PubMed
-
- Otto M (2010) Basis of virulence in community-associated methicillin-resistant Staphylococcus aureus . Annu Rev Microbiol 64: 143–162. - PubMed
Publication types
MeSH terms
Substances
LinkOut - more resources
Full Text Sources
Other Literature Sources
Medical
Molecular Biology Databases
