Clinical Trial
. 2013 Oct 18;288(42):30752-30762.
doi: 10.1074/jbc.M113.503532. Epub 2013 Sep 6.

Transgenic expression of microRNA-185 causes a developmental arrest of T cells by targeting multiple genes including Mzb1

Affiliations
Clinical Trial

Transgenic expression of microRNA-185 causes a developmental arrest of T cells by targeting multiple genes including Mzb1

Serkan Belkaya et al. J Biol Chem. .

Abstract

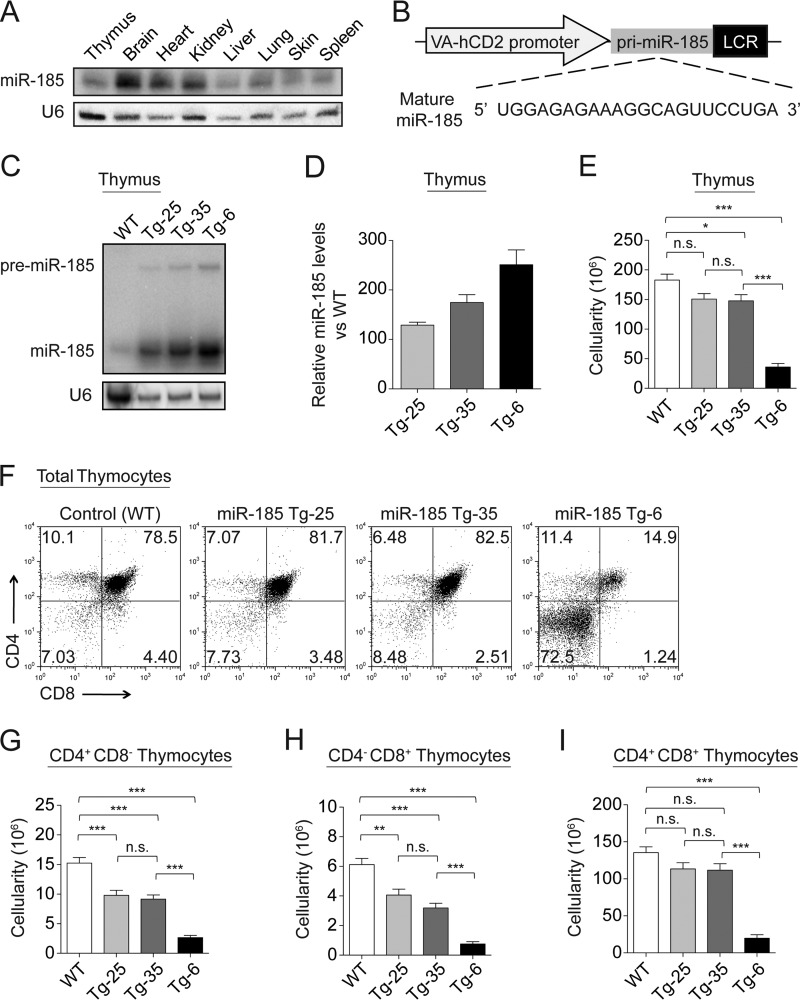
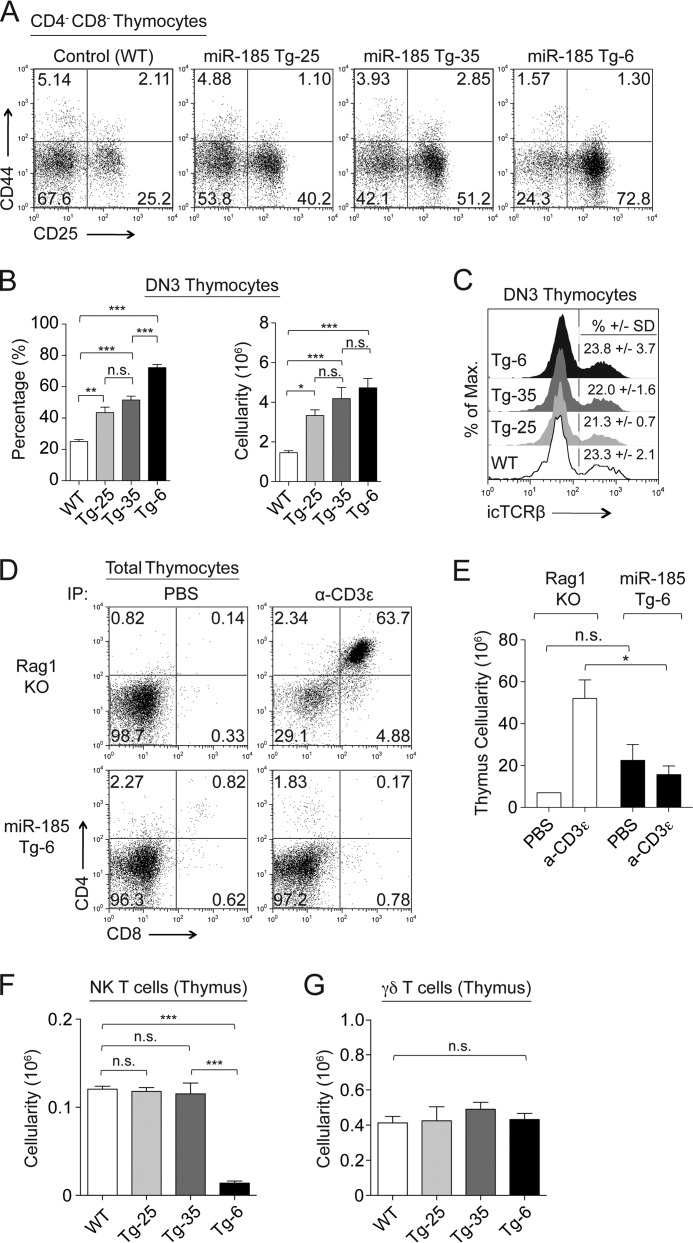
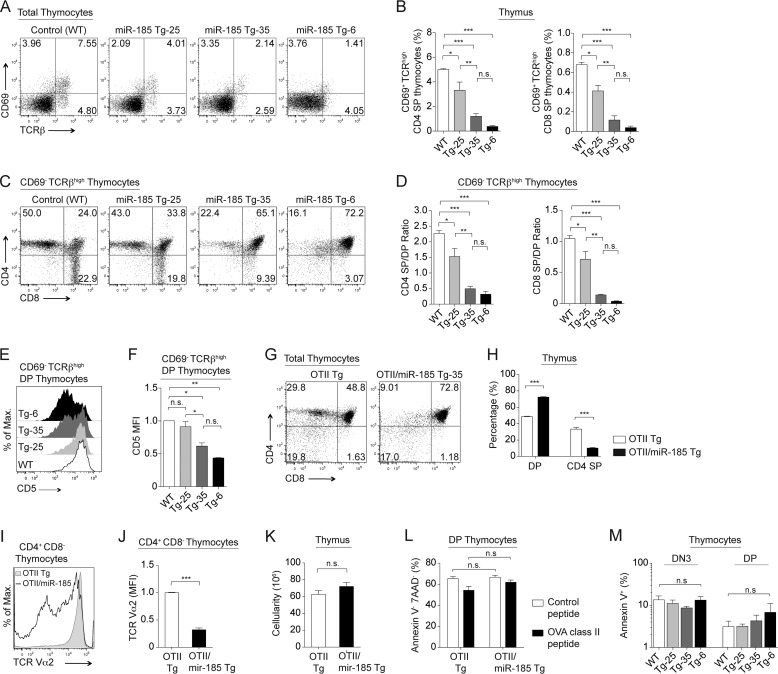
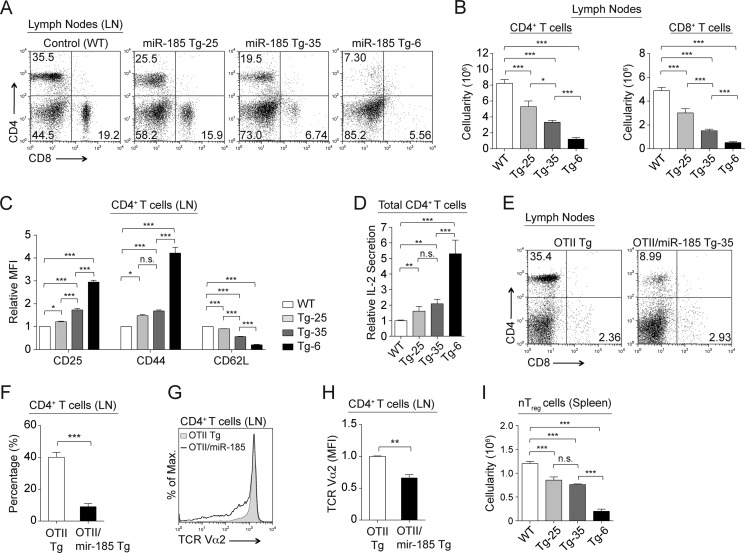
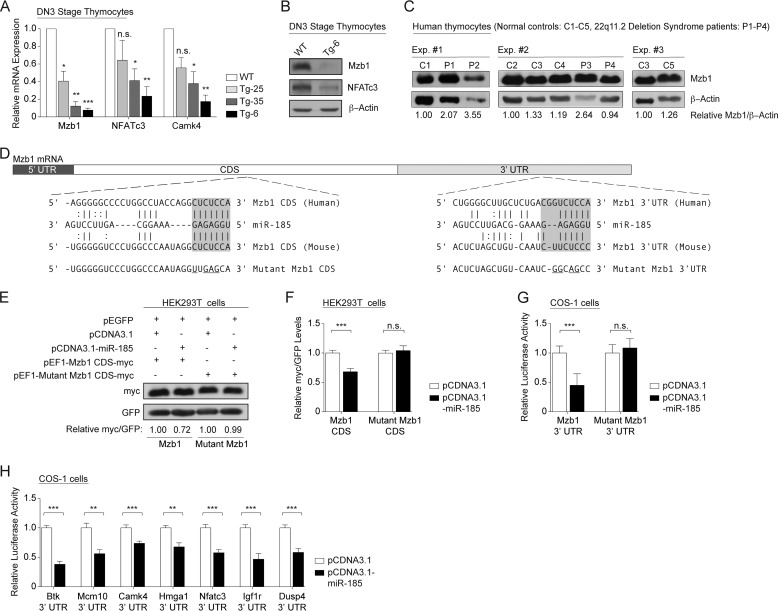
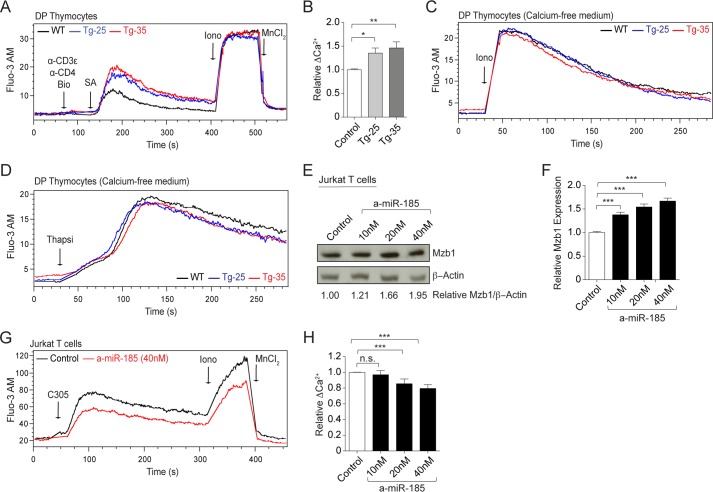
miR-185 is a microRNA (miR) that targets Bruton's tyrosine kinase in B cells, with reductions in miR-185 linked to B cell autoantibody production. In hippocampal neurons, miR-185 targets both sarcoplasmic/endoplasmic reticulum calcium ATPase 2 and a novel Golgi inhibitor. This miR is haploinsufficient in 90-95% of individuals with chromosome 22q11.2 deletion syndrome, patients who can present with immune, cardiac, and parathyroid problems, learning disorders, and a high incidence of schizophrenia in adults. The reduced levels of miR-185 in neurons cause presynaptic neurotransmitter release. Many of the 22q11.2 deletion syndrome patients have a thymic hypoplasia, which results in a peripheral T cell lymphopenia and unusual T helper cell skewing. The molecular targets of miR-185 in thymocytes are unknown. Using an miR-185 T cell transgenic approach, increasing levels of miR-185 attenuated T cell development at the T cell receptor β (TCRβ) selection checkpoint and during positive selection. This caused a peripheral T cell lymphopenia. Mzb1, Nfatc3, and Camk4 were identified as novel miR-185 targets. Elevations in miR-185 enhanced TCR-dependent intracellular calcium levels, whereas a knockdown of miR-185 diminished these calcium responses. These effects concur with reductions in Mzb1, an endoplasmic reticulum calcium regulator. Consistent with their haploinsufficiency of miR-185, Mzb1 levels were elevated in thymocyte extracts from several 22q11.2 deletion syndrome patients. Our findings indicate that miR-185 regulates T cell development through its targeting of several mRNAs including Mzb1.

Keywords: 22q11.2 Deletion Syndrome; Calcium Intracellular Release; Genetic Diseases; Immunodeficiency; MicroRNA; T Cell Biology; Transcription Target Genes; Transgenic Mice.


Figures

FIGURE 1.
FIGURE 1.
Elevations in miR-185 impair T cell development. A, miR-185 expression in various tissues assessed by Northern blotting. U6 probe was used as the endogenous control. B, VA-hCD2 transgenic cassette. Primary miR-185 (pri-miR-185) was cloned under control of the human CD2 promoter, which enables mature miR-185 expression in T cells. C, a representative Northern blot demonstrating the expression levels of miR-185 in the thymus of the control and transgenic lines. D, relative overexpression levels of miR-185 in different transgenic lines were determined by Northern blotting. The wild type control was set as 1. Bars show the mean -fold changes ± S.E. normalized to the U6 levels from two independent experiments. E, total thymus cellularity in the control and miR-185 Tg mice. F, total thymocytes from control and miR-185 Tg mice were stained for CD4 and CD8 and analyzed by FACS. G–I, bar graphs show absolute cell numbers of the CD4+CD8 thymocytes (G), CD4CD8+ thymocytes (H), and CD4+CD8+ thymocytes (I) in the control and miR-185 Tg mice. Data are of the mean ± S.E. from WT (n = 50), Tg-25 (n = 20), Tg-35 (n = 40), and Tg-6 (n = 70) mice (n.s. = nonsignificant, *, p < 0.05, **, p < 0.01, ***, p < 0.001; one-way ANOVA followed by Tukey's post hoc test).
FIGURE 2.
FIGURE 2.
Increasing levels of miR-185 attenuate T cell development at pre-TCRβ selection checkpoint. A, surface expression of CD25 and CD44 gated on CD4CD8 (B220, NK1.1, TCRγδ, CD11b, and CD11c) thymocytes of the control and miR-185 Tg mice. B, percentages (left) and absolute cell numbers (right) of DN3 (CD25+CD44) thymocytes are shown as the mean ± S.E. using at least six mice per group (n.s. = nonsignificant, *, p < 0.05, **, p < 0.01, ***, p < 0.001; one-way ANOVA followed by Tukey's post hoc test). C, histograms show expression levels of intracellular TCRβ (icTCRβ) in DN3 thymocytes. The mean percentages ± S.D. values of intracellular TCRβ expression were shown for the miR-185 Tg and control mice (n > 2 mice per group). D, total thymocytes from PBS or anti-CD3ϵ treated Rag1−/− and miR-185 Tg-6 mice were stained for CD4 and CD8 and analyzed by FACS at 5 days after intraperitoneal (IP) injection. E, total thymus cellularity of anti-CD3ϵ and PBS injected Rag1−/− and miR-185 Tg-6 mice (n = 3 mice per group; n.s. = nonsignificant, *, p < 0.05, **, p < 0.01, ***, p < 0.001; two-way ANOVA followed by Bonferroni's post hoc test). F and G, bar graphs represent the mean ± S.E. cell numbers of NK T cells (F) and γδ T cells (G) in the thymus of the control and miR-185 Tg mice using at least three mice per group (n.s. = nonsignificant, *, p < 0.05, **, p < 0.01, ***, p < 0.001; one-way ANOVA followed by Tukey's post hoc test).
FIGURE 3.
FIGURE 3.
Increasing levels of miR-185 attenuate T cell development at TCR-positive selection checkpoint. A, flow cytometric analysis of CD69 and TCRβ expression on total thymocytes from the control and miR-185 Tg mice. B, percentages of CD69+TCRβhigh CD4 SP and CD69+TCRβhigh CD8 SP thymocytes are shown. C, plots represent CD4 by CD8 profiles of CD69TCRβhigh thymocytes. D, cellularity ratios of the CD69TCRβhigh CD4 SP (left) and the CD69TCRβhigh CD8 SP (right) to the CD69TCRβhigh DP thymocytes were established for the results shown in C. E, histogram shows CD5 expression on CD69TCRβhigh DP thymocytes. F, relative mean fluorescence intensity (MFI) levels of CD5 in CD69TCRβhigh DP thymocytes. A–F, each bar is the mean ± S.E. of three independent experiments (n.s. = nonsignificant, *, p < 0.05, **, p < 0.01, ***, p < 0.001; one-way ANOVA followed by Tukey's post hoc test). G, flow cytometric analysis of CD4 and CD8 expression on total thymocytes from OTII Tg and OTII/miR-185 Tg-35 mice. H, average percentages of DP and CD4 SP thymocytes are shown. I, surface expression of TCR Vα2 gated on CD4+CD8 thymocytes from OTII Tg (dark gray) and OTII/miR-185 Tg-35 mice (black line). J, relative mean fluorescence intensity (MFI) levels of TCR Vα2 on CD4+CD8 thymocytes. K, total thymus cellularity of OTII Tg and OTII/miR-185 Tg mice was represented. G–K, data are of at least six mice per group. Bar graphs represent the mean ± S.E. values (*, p < 0.05, **, p < 0.01, ***, p < 0.001; two-tailed unpaired Student's t test). L, live (annexin V 7-aminoactinomycin D (7AAD)) percentages of DP thymocytes upon in vitro treatment of OTII Tg and OTII/miR-185 Tg thymocytes with SIINFEKL peptide as a negative control and OVA class II peptide. Each bar is the mean ± S.E. of three mice per group (n.s. = nonsignificant, *, p < 0.05, **, p < 0.01, ***, p < 0.001; two-way ANOVA followed by Bonferroni's post hoc test). M, graph shows the mean ± S.E. percentages of annexin V+ DN3 and DP thymocytes from control (white), Tg-25 (light gray), Tg-35 (dark gray), and Tg-6 (black) mice (n = 3 mice per group) (n.s. = nonsignificant, *, p < 0.05, **, p < 0.01, ***, p < 0.001; one-way ANOVA followed by Tukey's post hoc test).
FIGURE 4.
FIGURE 4.
Elevated levels of miR-185 cause a peripheral T cell lymphopenia. A, flow cytometric analysis of CD4+ and CD8+ T cells in the lymph nodes from normal and miR-185 Tg mice. B, bar graphs show absolute numbers of CD4+ and CD8+ T cells in the lymph nodes in the control and miR-185 Tg mice. Data are of the mean ± S.E. from WT (n = 40), Tg-25 (n = 16), Tg-35 (n = 46), and Tg-6 (n = 59) mice (*, p < 0.05, **, p < 0.01, ***, p < 0.001; one-way ANOVA followed by Tukey's post hoc test). C, relative mean fluorescence intensity (MFI) levels ± S.E. of CD25, CD44, and CD62L markers on CD4+ T cells in the lymph nodes of WT (white), Tg-25 (light gray), Tg-35 (dark gray), and Tg-6 (black) mice using at least five mice per group (n.s. = nonsignificant, *, p < 0.05, **, p < 0.01, ***, p < 0.001; one-way ANOVA followed by Tukey's post hoc test). D, graph represents relative IL-2 secretion from anti-CD3ϵ/CD28 stimulated total CD4+ T cells in miR-185 Tg lines and the control (WT), set to 1. Each bar is the mean ± S.E. of at least five independent experiments (n.s. = nonsignificant, *, p < 0.05, **, p < 0.01, ***, p < 0.001; Two-tailed unpaired Student's t test). E, lymphocytes from the lymph nodes of OTII Tg and OTII/miR-185 Tg mice were stained for CD4 and CD8 and analyzed by FACS. F, average percentages of CD4+CD8 T cells in the lymph nodes. G, surface expression of TCR Vα2 gated on CD4+CD8 T cells from the lymph nodes of OTII Tg (dark gray) and OTII/miR-185 Tg mice (black line). H, relative mean fluorescence intensity (MFI) levels of TCR Vα2 on CD4+CD8 lymphocytes. E–H, data are of at least six mice per group. Bar graphs represent the mean ± S.E. values (*, p < 0.05, **, p < 0.01, ***, p < 0.001; two-tailed unpaired Student's t test). I, graph shows absolute numbers of natural regulatory T (nTreg) cells in the spleen of the control and miR-185 Tg mice. Data are of the mean ± S.E. from at least three mice per group (n.s. = nonsignificant, *, p < 0.05, **, p < 0.01, ***, p < 0.001; one-way ANOVA followed by Tukey's post hoc test).
FIGURE 5.
FIGURE 5.
miR-185 targets a number of genes in developing thymocytes. A, relative mRNA levels of Mzb1, Nfatc3, and Camk4 in DN3 thymocytes, normalized to the endogenous Gapdh levels, were determined by real-time quantitative PCR. WT values were set to 1. Data shown are of the mean ± S.E. of at least three independent experiments performed in triplicates. Bars are representative of WT (white), Tg-25 (light gray), Tg-35 (dark gray), and Tg-6 (black) mice. (n.s. = nonsignificant, *, p < 0.05, **, p < 0.01, ***, p < 0.001; versus the threshold set as 1; one sample Student's t test) B, immunoblot analysis of Mzb1 and NFATc3 expression in miR-185 Tg-6 DN3 thymocytes when compared with the wild type control. β-Actin was used as the endogenous control. C, Mzb1 protein expression levels in human thymocytes obtained from five normal individuals (C1–C5) and four patients with 22q11.2 deletion syndrome (P1–P4). β-Actin was used as the endogenous control. Band intensities of Mzb1 and β-actin were measured using the ImageJ software. The Mzb1/β-actin ratio was calculated by dividing the band intensity of Mzb1 to that of the β-actin for each sample. Relative Mzb1 levels were then determined for each experiment (Exp #1–Exp. #3.) indicated as a group. This was done by normalizing the Mzb1/β-actin ratio for each sample relative to the first control sample. The first control sample was set as 1 in each of three independent experiments. D, the Mzb1 CDS and 3′-UTR each contain one putative miR-185 binding site. The diagram shows conserved miR-185 base pairing with human and murine Mzb1 mRNA. Mutated Mzb1 sequences are underlined. E, miR-185 directly targets Mzb1 CDS. A representative blot was shown from HEK293T cells transfected with the plasmid (pEF1) containing either wild type Mzb1 CDS-Myc or mutant Mzb1 CDS-Myc fusion, along with the empty vector (white) or pCDNA3.1/miR-185 (black). A GFP-expressing plasmid (pEGFP) was used as the transfection control. Band intensities of Myc and GFP were calculated for each lane using the ImageJ software. Relative Myc levels in the wild type Mzb1 or mutant Mzb1 transfectants were determined by normalizing the Myc/GFP ratio of pCDNA3.1/miR-185 to that of the pCDNA3.1 control, which was set as 1. F, graph shows the mean ± S.E. of relative Myc/GFP levels from four independent experiments performed in at least duplicates (n.s. = nonsignificant, *, p < 0.05, **, p < 0.01, ***, p < 0.001; two-tailed unpaired Student's t test). G, the Mzb1 3′-UTR is a direct target of miR-185. H, validation of additional miR-185 targets. G–H, luciferase activity was normalized to the β-galactosidase of COS-1 cells transfected with the luciferase plasmids containing the indicated 3′-UTR, along with either the empty vector or pCDNA3.1-miR-185. Normalized luciferase activity of the pCDNA3.1/miR-185 (black) transfectant was determined relative to that of the empty pCDNA3.1 vector (white), which was set as 1. Btk 3′-UTR, a previously validated target of miR-185, was used as a positive control. Data shown are of the mean ± S.E. from four independent experiments performed in at least triplicates (*, p < 0.05, **, p < 0.01, ***, p < 0.001; two-tailed unpaired Student's t test).
FIGURE 6.
FIGURE 6.
miR-185 controls TCR-stimulated intracellular calcium responses. A, intracellular calcium flux was analyzed by flow cytometry in DP thymocytes from the WT (black line), Tg-25 (blue line), and Tg-35 (red line) mice. DP thymocytes were gated by size. Black arrows indicate the time points for each treatment. Fluo-3 AM-loaded thymocytes were treated with biotinylated (Bio) anti-CD3ϵ and anti-CD4 followed by streptavidin (SA), ionomycin (Iono), and MnCl2. B, graph shows relative changes in TCR-triggered peak Ca2+-influx over the base line. Each bar represents the mean ± S.E. of six independent experiments (*, p < 0.05, **, p < 0.01, ***, p < 0.001; two-tailed unpaired Student's t test). C and D, Fluo-3 AM-loaded thymocytes were treated with ionomycin (Iono) (C) and thapsigargin (Thapsi) (D) in the absence of extracellular calcium. DP thymocytes were gated electronically. Experiments were repeated two times, and representative plots are shown from the WT (black line), Tg-25 (blue line), and Tg-35 (red line) mice. E, representative immunoblot shows Mzb1 expression in Jurkat T cells transfected with varying concentrations of miR-185 inhibitor (a-miR-185) when compared with the control (miR negative control inhibitor). β-Actin was used as the endogenous control. Band intensities of Mzb1 and β-actin were measured using the ImageJ software. The relative amounts of Mzb1 protein were shown as normalized to the control inhibitor, which was set as 1. This was done by dividing the Mzb1/β-actin ratio of each sample to that of the control sample. F, graph represents the mean ± S.E. of relative Mzb1 levels in Jurkat T cells transfected with the control and miR-185 inhibitor from five independent experiments, performed in at least duplicates (*, p < 0.05, **, p < 0.01, ***, p < 0.001; two-tailed unpaired Student's t test). G, intracellular calcium responses were analyzed by flow cytometry over time in Jurkat T cells following transfection with a-miR-185 (red line) and the control inhibitor (black line). Fluo-3 AM-loaded Jurkat T cells were treated with the mAb C305.2 (C305) (anti-TCRβ), ionomycin (Iono), and MnCl2. Black arrows indicate the time points for each treatment. H, graph shows relative changes in TCR-triggered peak Ca2+ influx over the base line. Each bar represents the mean ± S.E. of four independent experiments (n.s. = nonsignificant, *, p < 0.05, **, p < 0.01, ***, p < 0.001; two-tailed unpaired Student's t test).

Similar articles

Cited by

References

    1. Bartel D. P. (2004) MicroRNAs: genomics, biogenesis, mechanism, and function. Cell 116, 281–297 - PubMed
    1. Kloosterman W. P., Plasterk R. H. (2006) The diverse functions of microRNAs in animal development and disease. Dev. Cell 11, 441–450 - PubMed
    1. Papadopoulou A. S., Dooley J., Linterman M. A., Pierson W., Ucar O., Kyewski B., Zuklys S., Hollander G. A., Matthys P., Gray D. H., De Strooper B., Liston A. (2012) The thymic epithelial microRNA network elevates the threshold for infection-associated thymic involution via miR-29a mediated suppression of the IFN-α receptor. Nat. Immunol. 13, 181–187 - PMC - PubMed
    1. Cobb B. S., Nesterova T. B., Thompson E., Hertweck A., O'Connor E., Godwin J., Wilson C. B., Brockdorff N., Fisher A. G., Smale S. T., Merkenschlager M. (2005) T cell lineage choice and differentiation in the absence of the RNase III enzyme Dicer. J. Exp. Med. 201, 1367–1373 - PMC - PubMed
    1. Belver L., de Yébenes V. G., Ramiro A. R. (2010) MicroRNAs prevent the generation of autoreactive antibodies. Immunity 33, 713–722 - PMC - PubMed

Publication types

MeSH terms

Associated data