. 2013 Oct 18;288(42):30473-30484.
doi: 10.1074/jbc.M113.489914. Epub 2013 Sep 6.

Characterization of the AtsR hybrid sensor kinase phosphorelay pathway and identification of its response regulator in Burkholderia cenocepacia

Affiliations

Characterization of the AtsR hybrid sensor kinase phosphorelay pathway and identification of its response regulator in Burkholderia cenocepacia

Maryam Khodai-Kalaki et al. J Biol Chem. .

Abstract

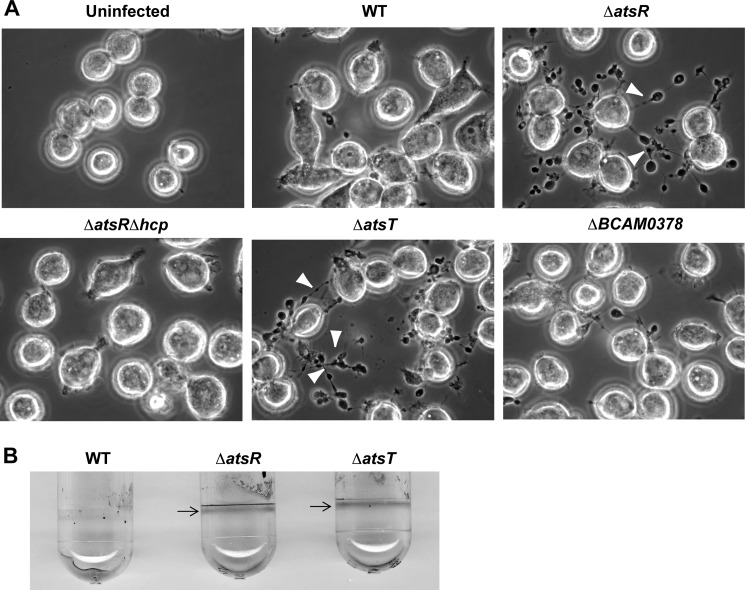
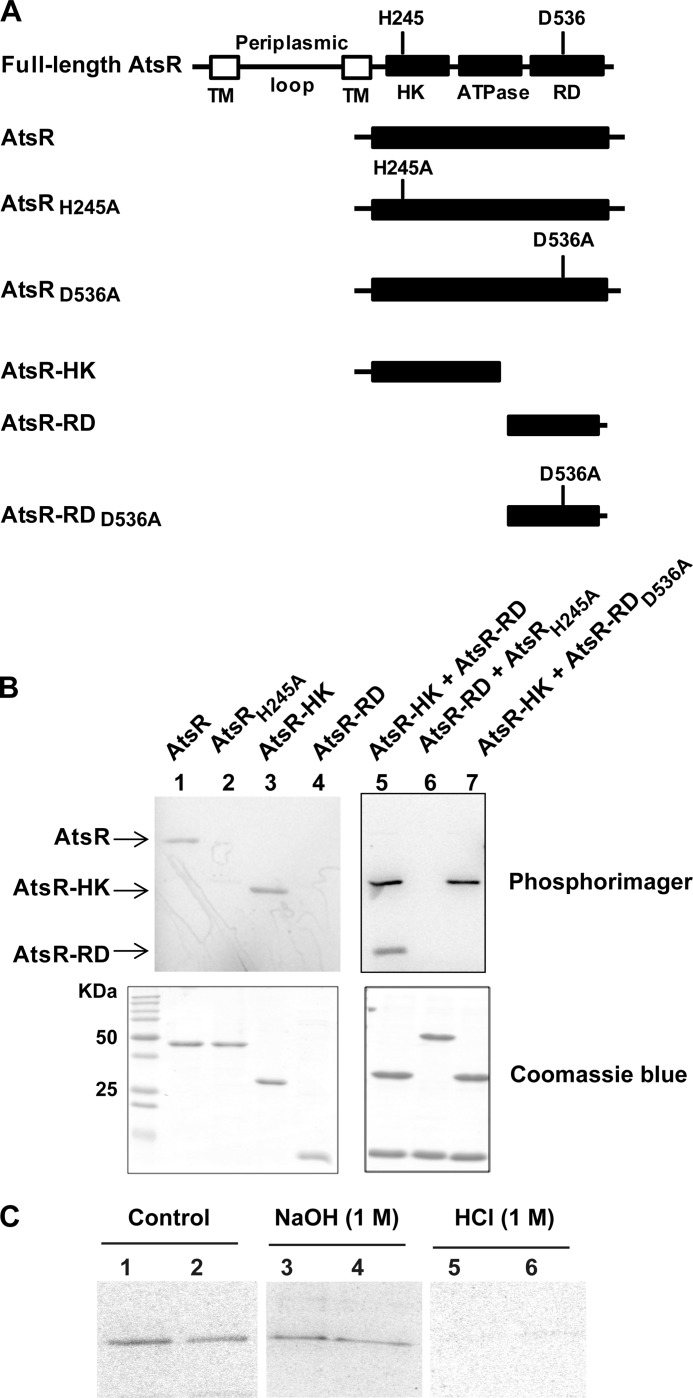
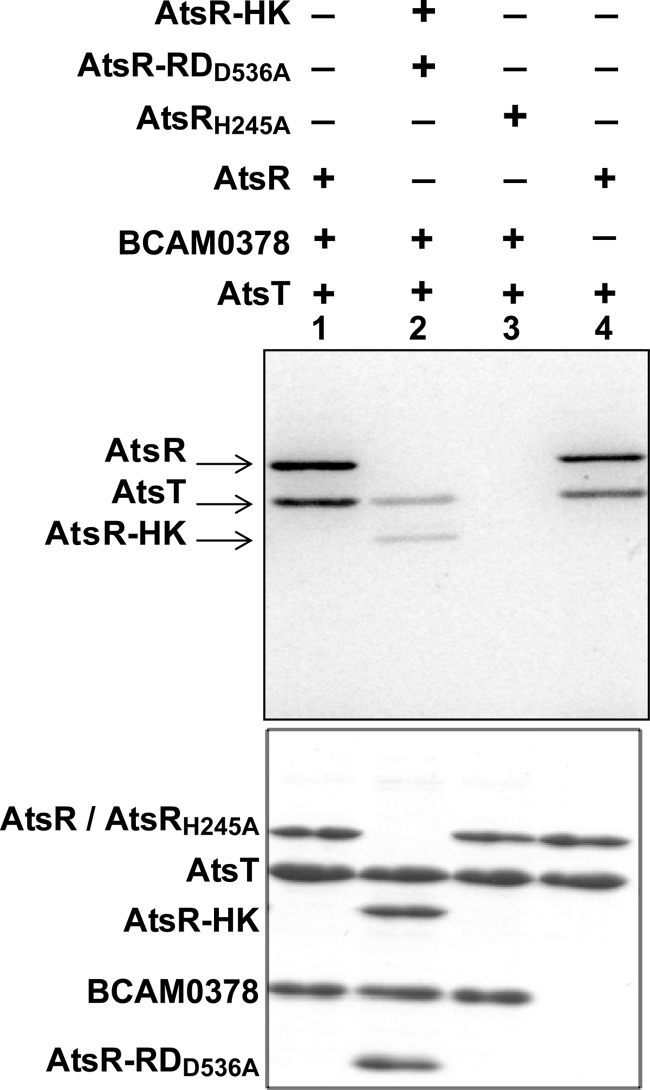
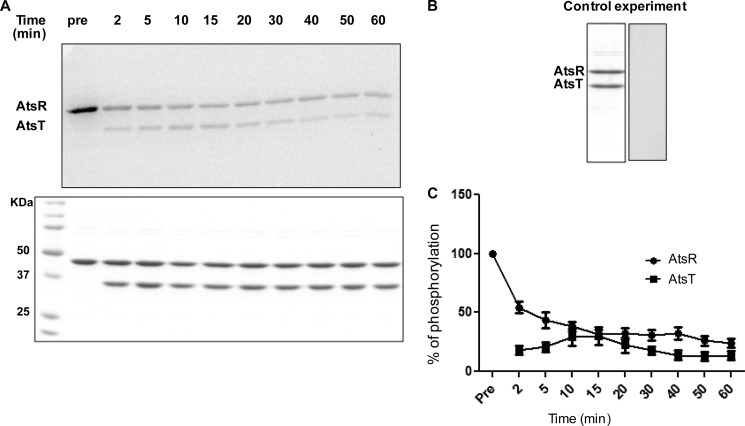
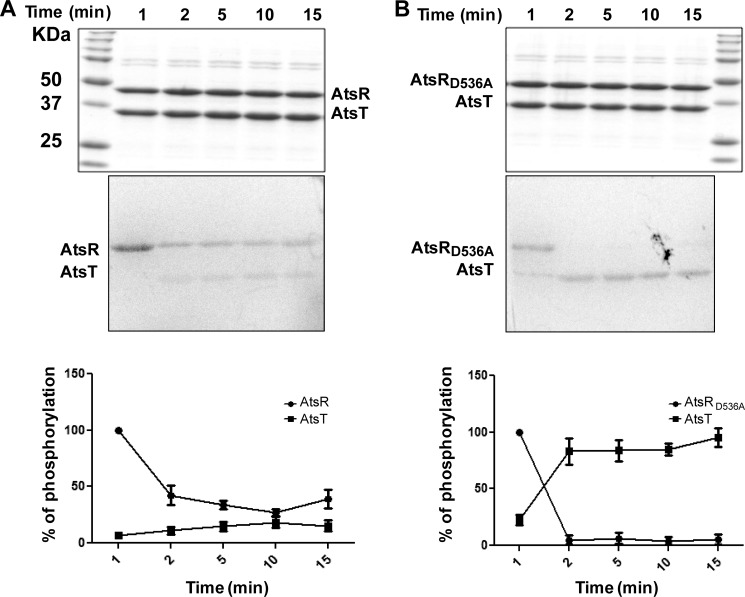
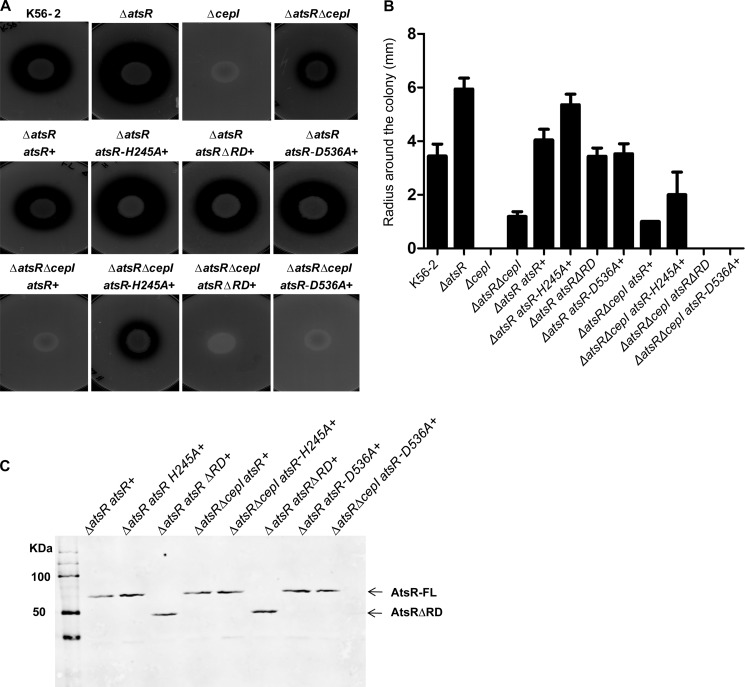
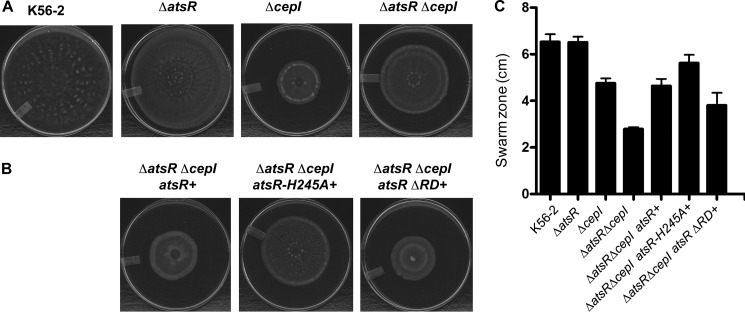
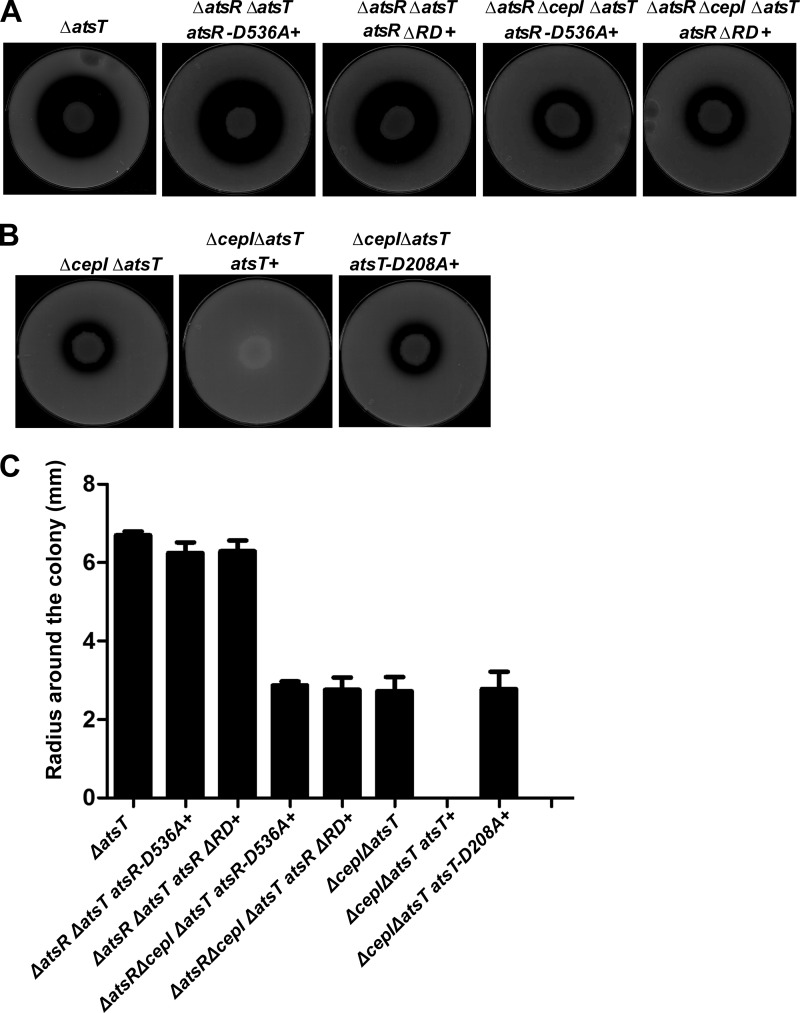
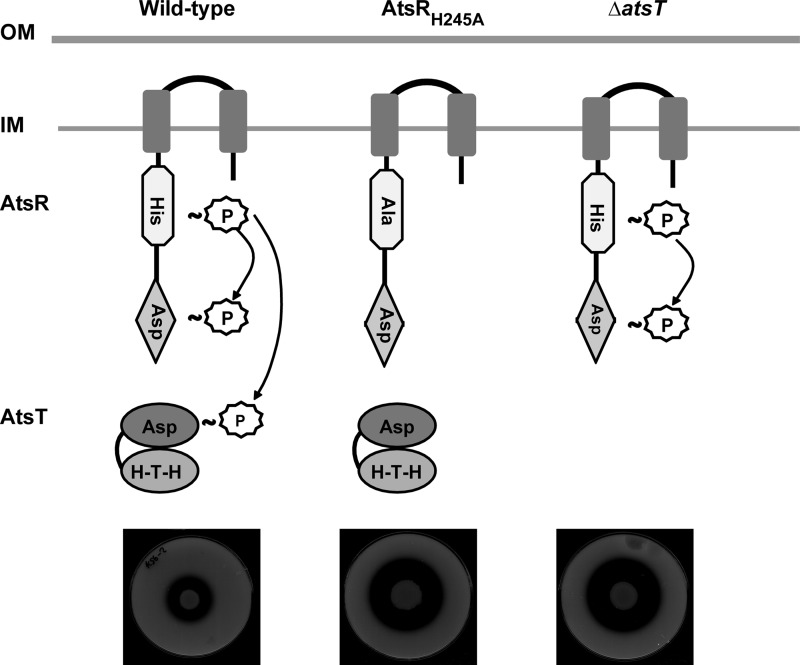
AtsR is a membrane-bound hybrid sensor kinase of Burkholderia cenocepacia that negatively regulates quorum sensing and virulence factors such as biofilm production, type 6-secretion, and protease secretion. Here we elucidate the mechanism of AtsR phosphorelay by site-directed mutagenesis of predicted histidine and aspartic acid phosphoacceptor residues. We demonstrate by in vitro phosphorylation that histidine 245 and aspartic acid 536 are conserved sites of phosphorylation in AtsR, and we also identify the cytosolic response regulator AtsT (BCAM0381) as a key component of the AtsR phosphorelay pathway. Monitoring the function of AtsR and its derivatives in vivo by measuring extracellular protease activity and swarming motility confirmed the in vitro phosphorylation results. Together we find that the AtsR receiver domain plays a fine-tuning role in determining the levels of phosphotransfer from its sensor kinase domain to the AtsT response regulator.

Keywords: Bacterial Protein Kinases; Cystic Fibrosis; Histidine Kinases; Macrophages; Phosphorylation; Protease; Transcription Regulation; Virulence Factors.


Figures

FIGURE 1.
FIGURE 1.
T6SS activity and biofilm formation of B. cenocepacia K56-2 (WT) and its mutant derivatives. A, phase-contrast microscopy of infected ANA-1 murine macrophages to assess T6SS activity. Infections were performed at a multiplicity of infection of 50 for 4 h. White arrowheads indicate the presence of ectopic actin nucleation (pearls-on-a-string phenotype (15, 22)) extending from infected macrophages, which denotes T6SS activity. B. cenocepacia K56-2 ΔatsRΔhcp, a T6SS-defective mutant, was used as a negative control during the infections. Experiments consisted of three independent biological repeats where similar results were obtained. B, biofilm formation by parental strains, ΔatsR and ΔatsT mutants. B. cenocepacia K56-2 wild-type and derivative mutants were tested for biofilm formation by crystal violet staining. Arrows indicate the ring corresponding to the biofilm formation characteristic in ΔatsR (15) and ΔatsT mutants. The experiment was repeated three times in triplicate, and pictures were taken after 24 h of static incubation at 37 °C.
FIGURE 2.
FIGURE 2.
Functional analysis of AtsR domains. A, schematic domain organization of AtsR and its derivatives (domains are not drawn to scale). The predicted sites of phosphorylation are His-245 (H245) and Asp-536 (D536). TM, transmembrane domain; HK, histidine kinase domain; ATPase, ATPase domain; RD, receiver domain; A, alanine. B, In vitro phosphorylation assays. Five μmol of purified AtsR, AtsRH245A, AtsR-HK, AtsR-RD, AtsR-HK and AtsR-RD, AtsRH245A and AtsR-RD, and AtsR-HK and AtsR-RDD536A were added in a standard phosphorylation mixture (100 mm Tris-HCl, pH 8, 50 mm KCl, 5 mm MgCl2, 1 mm DTT, 5 μCi [γ-33P]ATP) and incubated for 15 min at 25 °C. Reactions were terminated by adding 3× SDS-PAGE loading buffer and resolved by SDS-PAGE. The phosphorylated proteins were visualized using a PhosphorImager (top). Phosphorylated and non-phosphorylated proteins were detected by Coomassie Blue staining (bottom). The location of phosphorylated bands of the AtsR, AtsR-HK, and AtsR-RD proteins are denoted with arrows. C, chemical stability of phosphorylated proteins. Phosphorylated AtsR (lanes 1, 3, and 5) and AtsRD536A (lanes 2, 4, and 6) were treated with 1 m NaOH or 1 m HCl or were left untreated for 45 min at room temperature. The reactions were neutralized with 0.25 volumes of 2 m Tris, pH 8, and analyzed by PhosphorImager after SDS-PAGE.
FIGURE 3.
FIGURE 3.
Phosphotransfer from AtsR and its derivatives to the AtsT response regulator. Five μmol of AtsR, AtsRH245A, and AtsR-HK was preincubated in individual standard phosphorylation mixtures (100 mm Tris-HCl pH 8, 50 mm KCl, 5 mm MgCl2, 1 mm DTT, 5 μCi [γ-33P]ATP) for 15 min at 25 °C followed by the addition of 5 μmol of AtsT and/or BCAM0378. Reactions were terminated by adding 3× SDS-PAGE loading buffer after 15 min. Samples were resolved on 16% SDS-PAGE gel and stained with Coomassie Blue (bottom). Phosphorylated proteins were visualized by a PhosphorImager (Top). Phosphorylated bands corresponding to the expected masses of AtsR, AtsR-HK, and AtsT polypeptides are indicated by arrows.
FIGURE 4.
FIGURE 4.
Kinetics of phosphotransfer from AtsR to AtsT. A, 5 μmol of AtsR were preincubated with 5 μCi ([γ-33P]ATP) in a standard phosphorylation mixture (100 mm Tris-HCl, pH 8, 50 mm KCl, 5 mm MgCl2, 1 mm DTT) for 15 min, and then 5 μmol of AtsT and 20 mm ATP were simultaneously added to the reaction. The reaction was chased over time at 25 °C. Aliquots were removed before and after the chase at the times indicated. Reactions were terminated by adding SDS-PAGE loading buffer. Samples were run on 16% SDS-PAGE gel and stained with Coomassie Blue (bottom). Phosphorylated proteins were visualized by a PhosphorImager (top). The images shown here are the representatives of two independent repeats. B, 5 μmol of AtsR was incubated simultaneously with both labeled and unlabeled ATP for 10 min followed by the addition of 5 μmol of AtsT and incubated for 15 min. Samples were run on 16% SDS-PAGE gels and stained with Coomassie Blue (left) or visualized by a PhosphorImager (right). C, the y axis represents the percentage of normalized absorbance of densitometry readings from bands corresponding to phosphorylated proteins obtained from two independent experiments.
FIGURE 5.
FIGURE 5.
Kinetics of phosphotransfer from AtsR and AtsRD536A to AtsT. After 10 min of preincubation of 5 μmol AtsR (A) or AtsRD536A (B) in a standard phosphorylation mixture (100 mm Tris-HCl, pH 8, 50 mm KCl, 5 mm MgCl2, 1 mm DTT, 5 μCi [γ-33P]ATP), AtsT was added to the reaction, and aliquots were removed at the times indicated. The reaction was performed at 25 °C and terminated by adding SDS-PAGE loading buffer. Samples were run on 16% SDS-PAGE gel and stained with Coomassie Blue (top). Phosphorylated proteins were visualized with a PhosphorImager (middle). The images shown here are the representatives of two independent repeats. The y axis represents the percentage of normalized absorbance of densitometry readings from bands corresponding to phosphorylated proteins obtained from two independent experiments (bottom).
FIGURE 6.
FIGURE 6.
Proteolytic activity of B. cenocepacia K56-2 wild-type, ΔatsR, ΔatsRΔcepI, and ΔcepI mutants and complemented mutants at the chromosomal level in different genetic backgrounds. A, proteolysis was tested on D-BHI milk agar plates. The plates shown are representatives of three experiments performed in triplicate. Zones of clearing around the colonies were measured at 48 h of incubation at 37 °C. B, values are the average radius ± S.D. in millimeters of three experiments performed in triplicate. C, anti-His Western blot analysis of the His-tag-purified membrane pellet of AtsR, AtsRΔRD, AtsRD536A, and AtsRH245A in B. cenocepacia. Arrows indicate the positions of full-length AtsR (AtsR, AtsRD536A, and AtsRH245A) and AtsRΔRD. AtsR-FL, full-length AtsR.
FIGURE 7.
FIGURE 7.
Swarming motility. B. cenocepacia K56-2 wild type and derivative mutants (A) and ΔatsR ΔcepI mutant complemented by the integration of atsR, atsR-H245A, and atsRΔRD at the chromosomal level (B) were tested for swarming motility. The plates are representatives of at least three experiments performed in triplicate. The extent of the swarm zone was measured, and error bars represent the S.D. (C).
FIGURE 8.
FIGURE 8.
Proteolytic activity of B. cenocepacia ΔatsT, ΔatsRΔatsT atsRΔRD+, ΔatsRΔcepIΔatsT atsRΔRD+, ΔatsRΔatsT atsRD536A+, and ΔatsRΔcepIΔatsT atsRD536A+. A, atsT was deleted from B. cenocepacia K56-2 ΔatsR atsRΔRD+, ΔatsRΔcepI atsRΔRD+, ΔatsR atsRD536A+, and ΔatsRΔcepI atsRD536A+ backgrounds. Mutants were tested on D-BHI milk agar plates. The plates shown are representatives of three experiments performed in triplicate. Zones of clearing around the colonies were measured at 48 h of incubation at 37 °C. B, atsT was deleted from B. cenocepacia K56-2 ΔcepI background, and the resulting strain was complemented with either atsT or atsTD208A at the chromosomal level. Mutants were tested on D-BHI milk agar plates. The plates shown are representatives of three experiments performed in triplicate. C, values are the average radius in millimeters of three experiments performed in triplicate.
FIGURE 9.
FIGURE 9.
Diagram depicting a model for AtsR phosphorelay. OM, outer membrane; IM, inner membrane; HTH, helix-turn-helix; P, phosphate. Plates denote the proteolytic activity expected in each condition.

Similar articles

Cited by

References

    1. Wolanin P. M., Thomason P. A., Stock J. B. (2002) Histidine protein kinases. Key signal transducers outside the animal kingdom. Genome Biol. 3, REVIEWS3013 - PMC - PubMed
    1. Krell T., Lacal J., Busch A., Silva-Jiménez H., Guazzaroni M. E., Ramos J. L. (2010) Bacterial sensor kinases. Diversity in the recognition of environmental signals. Annu. Rev. Microbiol. 64, 539–559 - PubMed
    1. Georgellis D., Lynch A. S., Lin E. C. (1997) In vitro phosphorylation study of the arc two-component signal transduction system of Escherichia coli. J. Bacteriol. 179, 5429–5435 - PMC - PubMed
    1. Uhl M. A., Miller J. F. (1994) Autophosphorylation and phosphotransfer in the Bordetella pertussis BvgAS signal transduction cascade. Proc. Natl. Acad. Sci. U.S.A. 91, 1163–1167 - PMC - PubMed
    1. Mahenthiralingam E., Baldwin A., Dowson C. G. (2008) Burkholderia cepacia complex bacteria. Opportunistic pathogens with important natural biology. J. Appl. Microbiol. 104, 1539–1551 - PubMed

Publication types

MeSH terms

LinkOut - more resources