. 2013 Oct 18;288(42):30773-30784.
doi: 10.1074/jbc.M113.489534. Epub 2013 Sep 6.

Dynamic analysis of the epidermal growth factor (EGF) receptor-ErbB2-ErbB3 protein network by luciferase fragment complementation imaging

Affiliations

Dynamic analysis of the epidermal growth factor (EGF) receptor-ErbB2-ErbB3 protein network by luciferase fragment complementation imaging

Jennifer L Macdonald-Obermann et al. J Biol Chem. .

Abstract

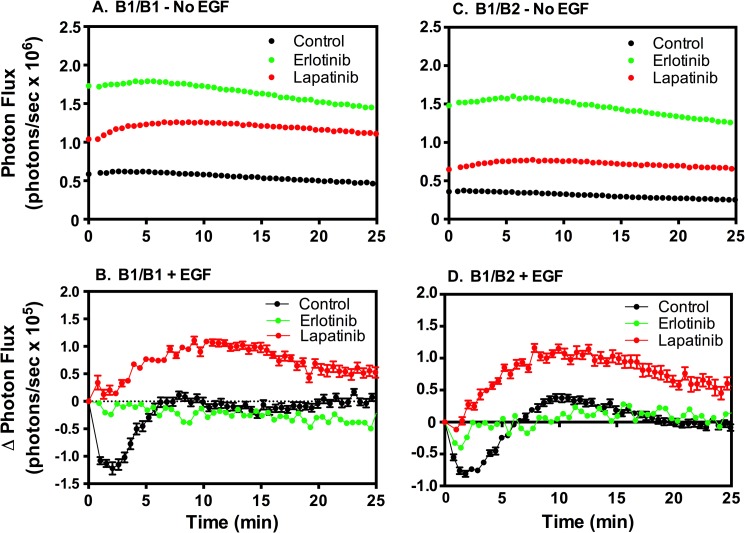
ErbB3 is a member of the ErbB family of receptor tyrosine kinases. It is unique because it is the only member of the family whose kinase domain is defective. As a result, it is obliged to form heterodimers with other ErbB receptors to signal. In this study, we characterized the interaction of ErbB3 with the EGF receptor and ErbB2 and assessed the effects of Food and Drug Administration-approved therapeutic agents on these interactions. Our findings support the concept that ErbB3 exists in preformed clusters that can be dissociated by NRG-1β and that it interacts with other ErbB receptors in a distinctly hierarchical fashion. Our study also shows that all pairings of the EGF receptor, ErbB2, and ErbB3 form ligand-independent dimers/oligomers. The small-molecule tyrosine kinase inhibitors erlotinib and lapatinib differentially enhance the dimerization of the various ErbB receptor pairings, with the EGFR/ErbB3 heterodimer being particularly sensitive to the effects of erlotinib. The data suggest that the physiological effects of these drugs may involve not only inhibition of tyrosine kinase activity but also a dynamic restructuring of the entire network of receptors.

Keywords: Cancer Biology; Epidermal Growth Factor (EGF); Epidermal Growth Factor Receptor (EGFR); ErbB2; ErbB3; Growth Factors; Receptor Tyrosine Kinase.


Figures

FIGURE 1.
FIGURE 1.
Luciferase complementation in ErbB3/ErbB3 and ErbB2/ErbB3 pairings. CHO cells stably coexpressing the indicated pairings were stimulated with increasing doses of NRG-1β, and luciferase complementation was measured as indicated under “Experimental Procedures.” A, CHO cells coexpressing ErbB3-NLuc and ErbB3-CLuc. B, CHO cells expressing ErbB2-NLuc and ErbB3-CLuc. C, CHO cells expressing ErbB3-NLuc and ErbB3 CLuc were stimulated with 10 nm NRG-1β in the absence of addition (Control), or in the presence of 300 nm tRNA or 300 nm A30 aptamer. D, CHO cells expressing ErbB2-NLuc and ErbB3 CLuc were stimulated with 10 nm NRG-1β in the absence of addition (Control), or in the presence of 300 nm tRNA or 300 nm A30 aptamer. Assays were done in quintuplicate, and values represent mean ± S.E.
FIGURE 2.
FIGURE 2.
Luciferase complementation in EGFR/ErbB3 pairings. CHO cells stably coexpressing EGFR-NLuc and ErbB3-CLuc were stimulated with increasing doses of NRG-1β (A) or EGF (B), and luciferase complementation was measured as indicated under “Experimental Procedures.” C, luciferase complementation in cells expressing EGFR-NLuc and ErbB3-CLuc stimulated with 10 nm EGF alone (red), 10 nm NRG-1β alone (green), or 10 nm EGF + 10 nm NRG-1β (black). D, luciferase complementation in cells expressing EGFR-NLuc and EGFR-CLuc transfected with an empty vector or untagged wild-type EGFR, Y246D-EGFR, or WT-ErbB3. Assays were done in quintuplicate, and values represent mean ± S.E.
FIGURE 3.
FIGURE 3.
Inhibition of ErbB kinase activity by monoclonal antibodies and small molecule tyrosine kinase inhibitors. CHO cells stably expressing the indicated ErbB receptors were grown to confluence in 6-well dishes and then treated with erlotinib (Erl), lapatinib (Lap), cetuximab (Cetux), trastuzumab (Tras), or pertuzumab (Pert) as described under “Experimental Procedures.” Cell were then stimulated for 2 min with either 10 nm EGF (A, B, and C) or 10 nm NRG-1β (D, E, and F). Cell lysates were prepared, analyzed by SDS-polyacrylamide gel electrophoresis, and visualized by Western blotting with the indicated antibodies.
FIGURE 4.
FIGURE 4.
The effect of erlotinib and lapatinib on basal luciferase complementation. CHO cells stably coexpressing the indicated pairs of ErbB receptors fused to NLuc or CLuc were treated with 5 μm erlotinib or lapatinib for 60 min prior to the assay for luciferase activity. Basal activity was taken as the average activity over the standard 25-min assay. Fold stimulation was determined by dividing the value obtained after treatment with erlotinib or lapatinib by the value obtained in cells treated with vehicle only. Values shown represent mean ± S.D. from two to four separate experiments done in quintuplicate. FKBP, FK506 binding protein; FRB, FKBP-rapamycin binding domain.
FIGURE 5.
FIGURE 5.
The effect of erlotinib and lapatinib on luciferase complementation between the EGF receptor and ErbB2. CHO cells stably coexpressing EGFR-NLuc and EGFR-CLuc (A and B) or EGFR-CLuc and ErbB2-NLuc (C and D) were treated with 5 μm erlotinib or lapatinib for 60 min. Cultures were then treated with vehicle (A and C) or 10 nm EGF (B and D) and assayed for luciferase activity. Assays were done in quintuplicate, and values represent mean ± S.E.
FIGURE 6.
FIGURE 6.
The effect of erlotinib and lapatinib on luciferase complementation in ErbB3 homo-oligomers. CHO cells stably expressing ErbB3-NLuc and ErbB3-CLuc were treated with 5 μm erlotinib or lapatinib for 60 min. Cultures were then treated with vehicle (A) or 10 nm NRG-1β (B) prior to assay for luciferase activity. Assays were done in quintuplicate, and values represent mean ± S.E.
FIGURE 7.
FIGURE 7.
The effect of erlotinib and lapatinib on luciferase complementation in ErbB2/ErbB3 heterodimers. A, CHO cells stably coexpressing ErbB2-NLuc and ErbB3-CLuc were treated with 5 μm erlotinib (Erlot) or lapatinib (Lapat) for 60 min. Cultures were then treated with vehicle (○) or 10 nm NRG-1β (NRG) (●) prior to the assay for luciferase activity. Con, control. B, C, and D, after treating with vehicle, erlotinib, or lapatinib, cells were stimulated with 10 nm NRG-1β and assayed for luciferase activity in the absence (○) or presence (●) of 300 nm A30. For the results shown in B, C, and D, luciferase activity was normalized for each treatment group by dividing the absolute change in photon flux observed in the presence of NRG-1β by the absolute photon flux in the absence of NRG-1β. Assays were done in quintuplicate.
FIGURE 8.
FIGURE 8.
The effect of erlotinib and lapatinib on luciferase complementation between the EGF receptor and ErbB3. CHO cells stably coexpressing EGFR-NLuc and ErbB3-CLuc were treated with 5 μm erlotinib or lapatinib for 60 min. Cultures were then treated with vehicle (A and C), 10 nm NRG-1β (NRG) (B), or 10 nm EGF (D) and assayed for luciferase activity. Assays were done in quintuplicate, and values represent mean ± S.E.
FIGURE 9.
FIGURE 9.
The effect of monoclonal antibodies on complementation between the EGF receptor and ErbB2. CHO cells stably coexpressing EGFR-NLuc and EGFR-CLuc (A) or EGFR-CLuc and ErbB2-NLuc (B) were treated with vehicle or 5 μg/ml cetuximab (Cetux), trastuzumab (Trastuz), or pertuzumab (Pertuz) for 20 min prior to the addition of 10 nm EGF and assayed for luciferase activity. Assays were done in quintuplicate, and values represent mean ± S.E.
FIGURE 10.
FIGURE 10.
The effect of monoclonal antibodies on complementation in ErbB3-containing dimers. CHO cells stably coexpressing ErbB3-NLuc and ErbB3-Cluc (A), ErbB2-NLuc and ErbB3-Cluc (B), or EGFR-NLuc (B1) and ErbB3-CLuc (C and D) were treated with vehicle or 5 μg/ml cetuximab (Cetux), trastuzumab (Trastuz), or pertuzumab (Pertuz) for 20 min prior to growth factor stimulation and assayed for luciferase activity. Cells in A, B, and D were stimulated with 10 nm NRG-1β. Cells in C were stimulated with 10 nm EGF. Assays were done in quintuplicate, and values represent mean ± S.E.

Similar articles

Cited by

References

    1. Ferguson K. M. (2008) Structure-based view of epidermal growth factor receptor regulation. Annu. Rev. Biophys. 37, 353–373 - PMC - PubMed
    1. Wilson K. J., Gilmore J. L., Foley J., Lemmon M. A., Riese D. J., 2nd (2009) Functional selectivity of EGF family peptide growth factors: Implications for cancer. Pharmacol. Ther. 122, 1–8 - PMC - PubMed
    1. Garrett T. P., McKern N. M., Lou M., Elleman T. C., Adams T. E., Lovrecz G. O., Zhu H.-J., Walker F., Frenkel M. J., Hoyne P. A., Jorissen R. N., Nice E. C., Burgess A. W., Ward C. W. (2002) Crystal Structure of a truncated epidermal growth factor receptor extracellular domain bound to transforming growth factor a. Cell 110, 763–773 - PubMed
    1. Ogiso H., Ishitani R., Nureki O., Fukai S., Yamanaka M., Kim J.-H., Saito K., Sakamoto A., Inoue M., Shirouzu M., Yokoyama S. (2002) Crystal structure of the complex of human epidermal growth factor and receptor extracellular domains. Cell 110, 775–787 - PubMed
    1. Ferguson K. M., Berger M. B., Mendrola J. M., Cho H.-S., Leahy D. J., Lemmon M. A. (2003) EGF Activates its receptor by removing interactions that autoinhibit ectodomain dimerization. Mol. Cell 11, 507–517 - PubMed

Publication types

MeSH terms