. 2013 Nov;347(2):310-7.
doi: 10.1124/jpet.113.207936. Epub 2013 Sep 6.

Effects of eugenol on T-type Ca2+ channel isoforms

Affiliations

Effects of eugenol on T-type Ca2+ channel isoforms

Haengsoo Seo et al. J Pharmacol Exp Ther. 2013 Nov.

Abstract

Eugenol has been used as an analgesic in dentistry. Previous studies have demonstrated that voltage-gated Na(+) channels and high-voltage-activated Ca(2+) channels expressed in trigeminal ganglion (TG) neurons sensing dental pain are molecular targets of eugenol for its analgesic effects. However, it has not been investigated whether eugenol can affect T-type Ca(2+) channels, which are known to be detected in the afferent neurons. In this report, we investigate how eugenol can influence cloned T-type channel isoforms expressed in HEK293 cells, using whole-cell patch clamp. Application of eugenol inhibited Cav3.1, Cav3.2, and Cav3.3 currents in a concentration-dependent manner with IC50 values of 463, 486, and 708 μM, respectively. Eugenol was found to negatively shift the steady-state inactivation curves of the T-type channel isoforms, but it did not shift their activation curves. In addition, eugenol had little effect on the current kinetics of Cav3.1 and Cav3.2, but it accelerated the inactivation kinetics of Cav3.3 currents. Reduction of channel availability enhanced eugenol inhibition sensitivity for Cav3.1 and Cav3.2, but not for Cav3.3. Moreover, eugenol inhibition of T-type channel isoforms was found to be use dependent. Finally, we show that the T-type currents recorded from rat TG neurons were inhibited by eugenol with a similar potency to Cav3.1 and Cav3.2 isoforms. Taken together, our findings suggest that T-type Ca(2+) channels are additional molecular targets for the pain-relieving effects of eugenol.


Figures

Fig. 1.
Fig. 1.
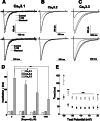
Eugenol inhibition of Cav3.1, Cav3.2, and Cav3.3 T-type Ca2+ isoforms. Time courses of the inhibitory effects of eugenol (0.1, 0.3, 1, and 3 mM) on T-type channel currents from HEK293 cells stably transfected with Cav3.1 (A), Cav3.2 (B), or Cav3.3 (C). Currents were elicited by a test pulse of −-20 mV from a holding potential of −90 mV every 10 seconds. Their representative current traces before and after eugenol inhibition are superimposed, as shown on the right side of each time course. (D) Dose-response curves of eugenol inhibition of T-type channel isoforms. Inhibition percentages of Cav3.1, Cav3.2, and Cav3.3 channel currents by serial concentrations of eugenol were averaged and plotted against eugenol concentrations (n = 5–13). The smooth curves were obtained from fitting data with the Hill equation, I = [1 + IC50/(eugenol)n]−1, where I is the normalized inhibition, IC50 is the concentration of eugenol required for half-maximal inhibition, and n is the Hill coefficient.
Fig. 2.
Fig. 2.
Eugenol effects on the current kinetics of T-type channel isoforms. Cav3.1 (A), Cav3.2 (B), and Cav3.3 (C) currents were elicited by step pulses to −20 mV from a holding potential of −90 mV. Representative traces before (black) and after application of 1 mM eugenol (gray), and after washout (dashed) of the drug are superimposed and are shown in the upper panels. The current traces were normalized to their peak current amplitude before eugenol treatment [see lower panels (A–C)], indicating that the inactivation rate of only the Cav3.3 current was accelerated by eugenol inhibition. (D) Eugenol effects on the inactivation time constants (τinact) of Cav3.1, Cav3.2, and Cav3.3 currents. The inactivation portion of each current was fitted with a single exponential equation [I = A*exp(−t/τ) + B], and the average value inactivation time constants (τ) are illustrated with bar graphs. Eugenol only accelerated the inactivation kinetics for Cav3.3 in a concentration-dependent manner (*P < 0.05 or **P < 0.01, Student’s t test; n = 5 or 6). (E) Eugenol effects on the inactivation time constants of Cav3.3 currents evoked by various test potentials. Currents elicited by serial step pulses ranging from −70 mV to +40 mV from a holding potential of −90 mV were measured before and after treatment with application of 500 μM. Currents were fitted with two exponential equations [I = A1exp(−t/τ1)+A2exp(−t/τ2)+C], where τ1 is the inactivation time constant and τ2 is the activation time constant. Average inactivation tau (τ) values before (○) and after 500 μM eugenol treatment (●) are plotted as a function of test potential. *P < 0.05, **P < 0.01, or ***P < 0.001) evaluated by Student’s unpaired t tests (n = 5 or 6). Data represent the mean ± S.E.M.
Fig. 3.
Fig. 3.
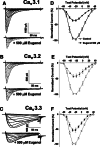
Eugenol effects on the current-voltage (I-V) relationships of T-type channel isoforms. Representative current traces of Cav3.1 (A), Cav3.2 (B), and Cav3.3 (C) before and after application of 500 μM eugenol were elicited by a voltage protocol composed of serial step pulses ranging from −70 mV to +40 mV by increments of 10 mV from a holding potential of −90 mV. (D–F) I-V relationships of Cav3.1, Cav3.2, and Cav3.3 channels before and after 500 μM eugenol treatment. Currents measured at various test potentials were normalized to the peak current at a test potential of −20 mV, and their normalized percentages are plotted against test potentials applied (n = 5–9). Eugenol inhibition percentages over different potentials are similar, suggesting that eugenol inhibition of T-type channel isoforms is voltage-independent.
Fig. 4.
Fig. 4.
Eugenol effects on the activation and channel availability curves of T-type channels. Activation and steady-state inactivation curves of Cav3.1 (A, circles), Cav3.2 (B, triangles), and Cav3.3 (C, squares) are displayed from before (open symbols) and after 500 μM eugenol treatment (closed symbols). Channel activation levels depending on voltage are from the chord conductance values obtained by dividing current amplitudes by driving forces (reversal potential minus test potential), normalized to the peak conductance. The normalized chord conductance values were averaged and plotted against the test potentials. Smooth curves were obtained from fitting the data to the Boltzmann equation {G = 1/[1+exp(V50,actV)/k]}, where V50,act is the half-activation voltage and k is a slope factor. The steady-state inactivation was evaluated by a two-step pulse protocol: A conditioning pulse of 10-second duration ranging from −110 mV to −45 mV by increments of 5 or 10 mV was followed by a step to −20 mV test potential. Currents recorded at −20 mV after the serial conditioning potentials were normalized to the current amplitude recorded at a conditioning potential of −90 mV, and then average inactivation percentages were plotted as a function of prepulse potentials. The normalized data were then fit to the Boltzmann equation. Data represent the mean ± S.E.M (n = 6–8).
Fig. 5.
Fig. 5.
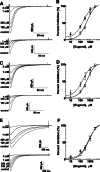
State-dependent inhibition effects of eugenol on T-type channel isoforms. Cav3.1 (A), Cav3.2 (C), and Cav3.3 (E) T-type currents were evoked by a test potential of −20 mV from different holding potentials of −90 mV (upper panels) or −75 mV (lower panels) in which the latter decreases channel availability to ∼50%. Representative current traces before and after serial concentrations of eugenol are superimposed and shown on the left side. (B, D, and F) Dose-response curves of eugenol inhibition of T-type channel isoform currents. Inhibition percentages of Cav3.1 (B), Cav3.2 (D), and Cav3.3 (F) currents evoked from a holding potential of −90 mV (open symbols) or −75 mV (closed symbols) were averaged and plotted against eugenol concentrations (n = 5–13). The smooth curves are obtained from fitting data to the Hill equation, I = [1 + IC50/(eugenol)n]−1, where I is the normalized inhibition, IC50 is the concentration of eugenol required for half-maximal inhibition, and n is the Hill coefficient.
Fig. 6.
Fig. 6.
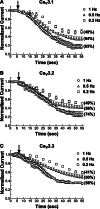
Use-dependent inhibition of T-type channel currents by eugenol. CaV3.1 (A), CaV3.2 (B), and CaV3.3 (C) currents were elicited by a step pulse of −20 mV from a holding potential of −90 mV with various frequencies of 0.2 Hz (□), 0.5 Hz (Δ), or 1 Hz (○). After current amplitude was stabilized, 500 μM eugenol was applied. The peak amplitudes of currents were normalized to the peak current amplitude before application of eugenol, and then the normalized average values (mean ± S.E.M.) were plotted against time (n = 4 or 5).
Fig. 7.
Fig. 7.
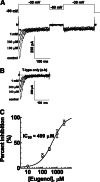
Eugenol inhibition profile of T-type currents recorded from TG neurons. (A) Ca2+ channel currents recorded in a 10 mM Ba2+ solution are superimposed before and after application of serial eugenol solutions (0.1, 0.3, and 1 mM). Currents were elicited every 10 seconds by a double pulse protocol composed of double step pulses of −30 mV and a intervening potential of −60 mV. (B) Isolation of pure T-type channel currents by subtracting the data points during the “b” period from those during “a” period. T-type channel currents isolated are superimposed before and after treatment of eugenol solutions (0.1, 0.3, and 1 mM). (C) Concentration-response curves of eugenol inhibition of T-type channel currents recorded from TG neurons. Inhibition percentages of TG neuron T-type currents by serial concentrations of eugenol were averaged and plotted against eugenol concentrations (n = 3–5). The smooth curves were obtained from fitting data to the Hill equation, I = [1 + IC50/(eugenol)n]−1, where I is the normalized inhibition, IC50 is the concentration of eugenol required for half-maximal inhibition, and n is the Hill coefficient.
Fig. 8.
Fig. 8.
Nickel sensitive inhibition of T-type currents recorded from TG neurons. (A) Representative T-type current traces before and after serial nickel solutions (1, 3, 10, and 30 μM) are superimposed. T-type channel currents from rat TG neurons were elicited by a step pulse of −35 (or −40) mV every 10 seconds. (B) Concentration-response curve of nickel inhibition of T-type channel currents recorded from TG neurons. Inhibition percentages of T-type channel currents by serial concentrations of nickel were averaged and plotted against nickel concentrations (n = 4–6). The smooth curve is obtained from fitting data with the Hill equation, I = [1 + IC50/(Ni2+)n]−1, where I is the normalized inhibition, IC50 is the concentration of nickel required for half-maximal inhibition, and n is the Hill coefficient.

Similar articles

Cited by

References

    1. Borgland SL, Connor M, Christie MJ. (2001) Nociceptin inhibits calcium channel currents in a subpopulation of small nociceptive trigeminal ganglion neurons in mouse. J Physiol 536:35–47. - PMC - PubMed
    1. Borgland SL, Connor M, Ryan RM, Ball HJ, Christie MJ. (2002) Prostaglandin E(2) inhibits calcium current in two sub-populations of acutely isolated mouse trigeminal sensory neurons. J Physiol 539:433–444. - PMC - PubMed
    1. Bourinet E, Alloui A, Monteil A, Barrère C, Couette B, Poirot O, Pages A, McRory J, Snutch TP, Eschalier A, et al. (2005) Silencing of the Cav3.2 T-type calcium channel gene in sensory neurons demonstrates its major role in nociception. EMBO J 24:315–324. - PMC - PubMed
    1. Chen CC, Lamping KG, Nuno DW, Barresi R, Prouty SJ, Lavoie JL, Cribbs LL, England SK, Sigmund CD, Weiss RM, et al. (2003) Abnormal coronary function in mice deficient in alpha1H T-type Ca2+ channels. Science 302:1416–1418. - PubMed
    1. Ertel EA, Cohen CJ. (1994) Voltage-dependent interactions: the influence and significance of membrane potential on drug-receptor interactions. Drug Dev Res 33:204–213.

Publication types

MeSH terms

LinkOut - more resources