

Glycine insertion makes yellow fluorescent protein sensitive to hydrostatic pressure
- PMID: 24014139
- PMCID: PMC3754940
- DOI: 10.1371/journal.pone.0073212
Glycine insertion makes yellow fluorescent protein sensitive to hydrostatic pressure
Abstract
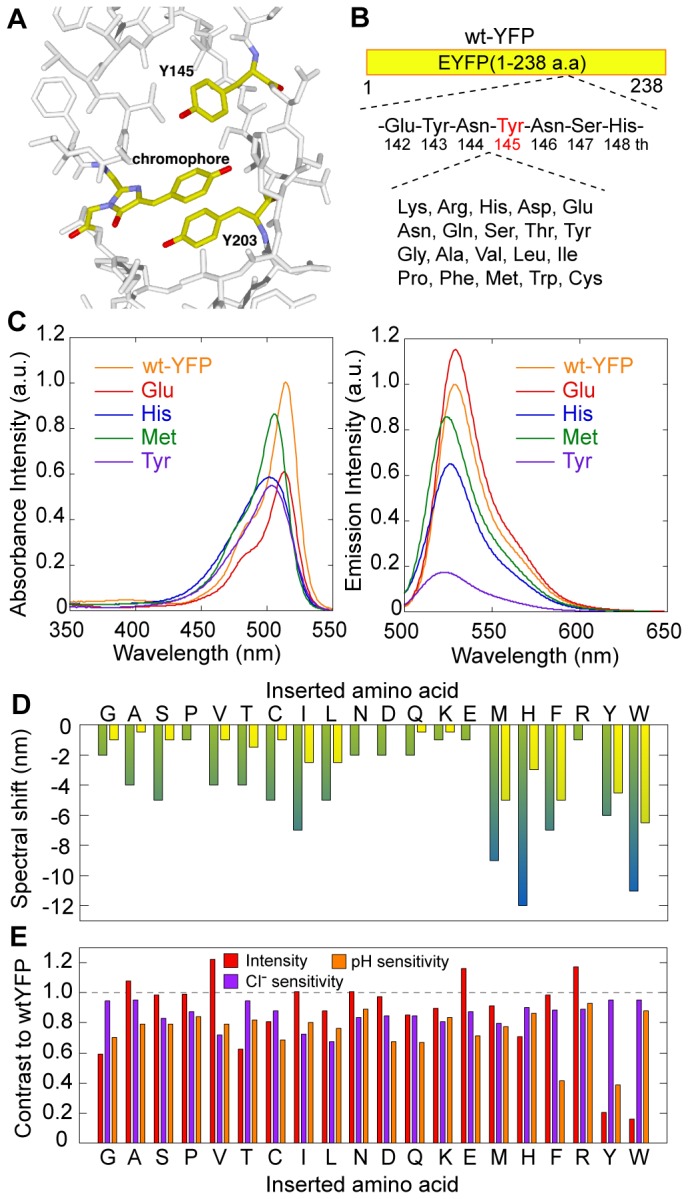
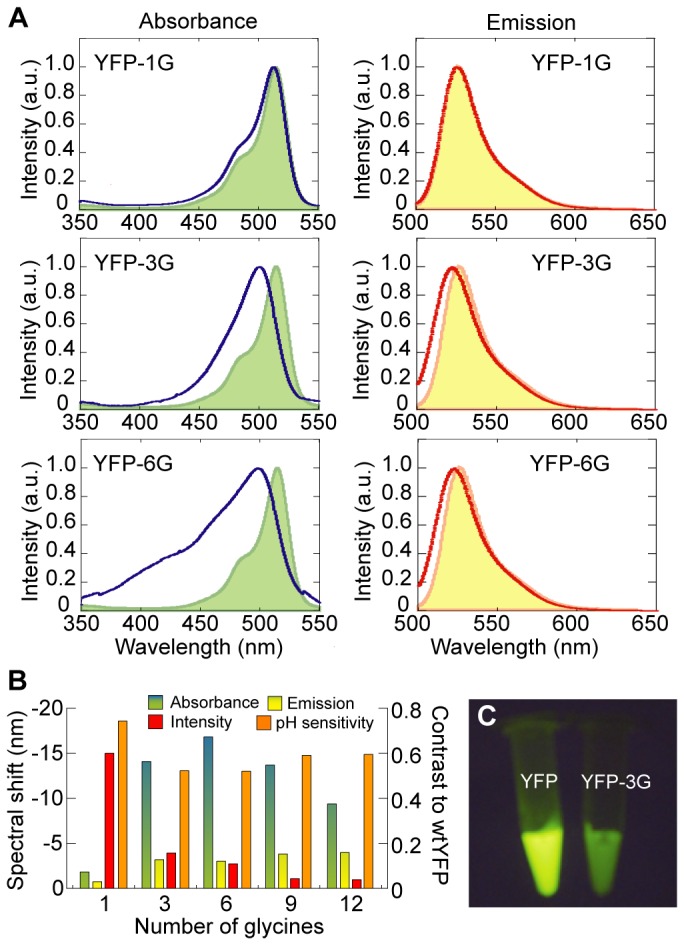
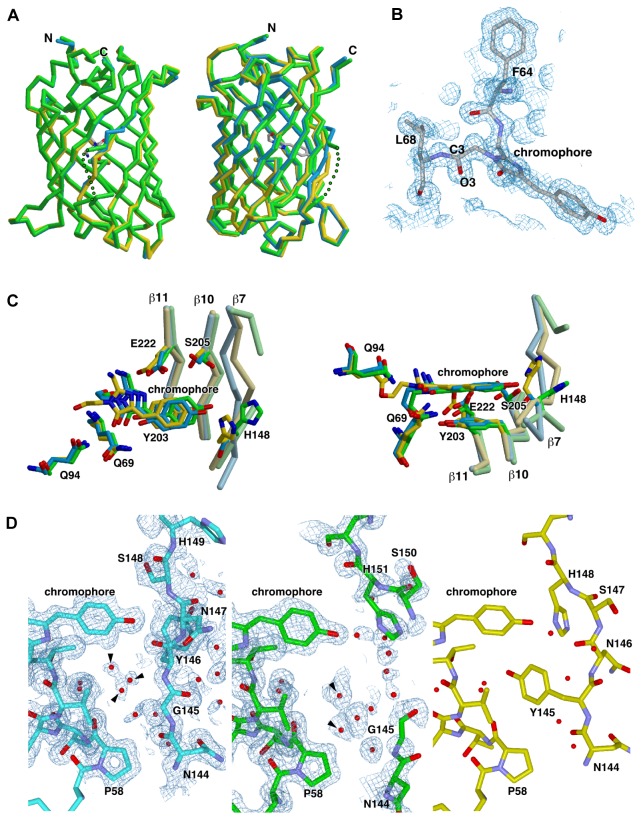
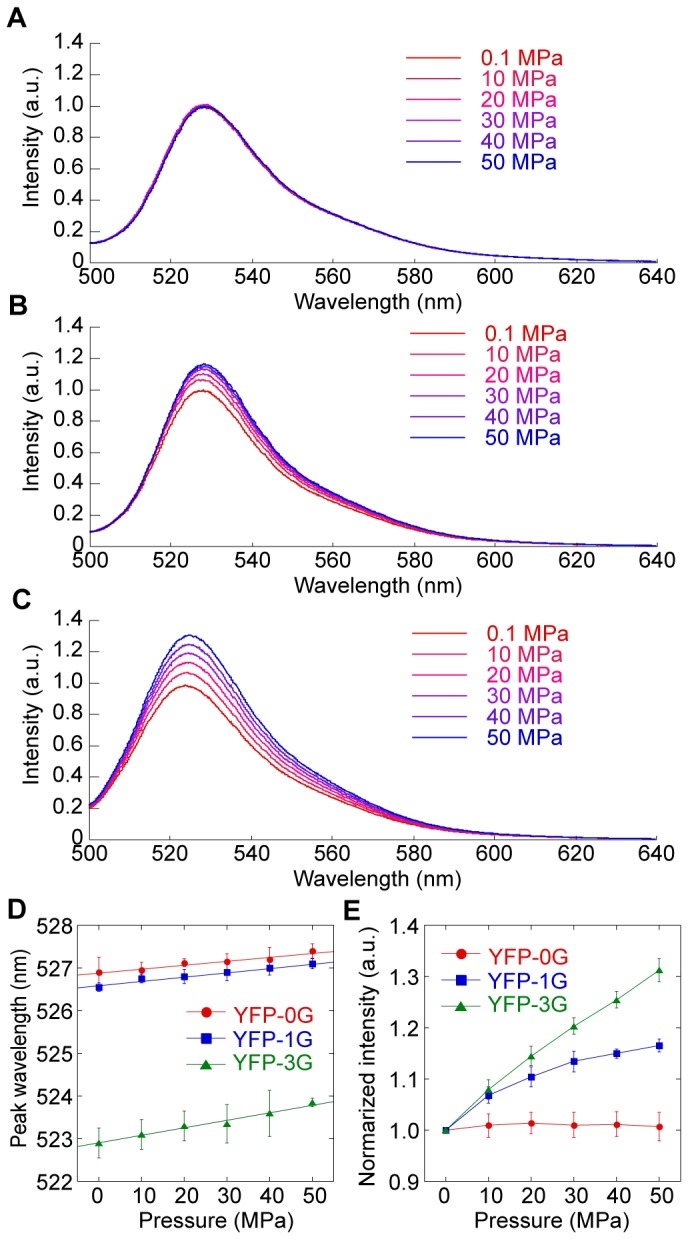
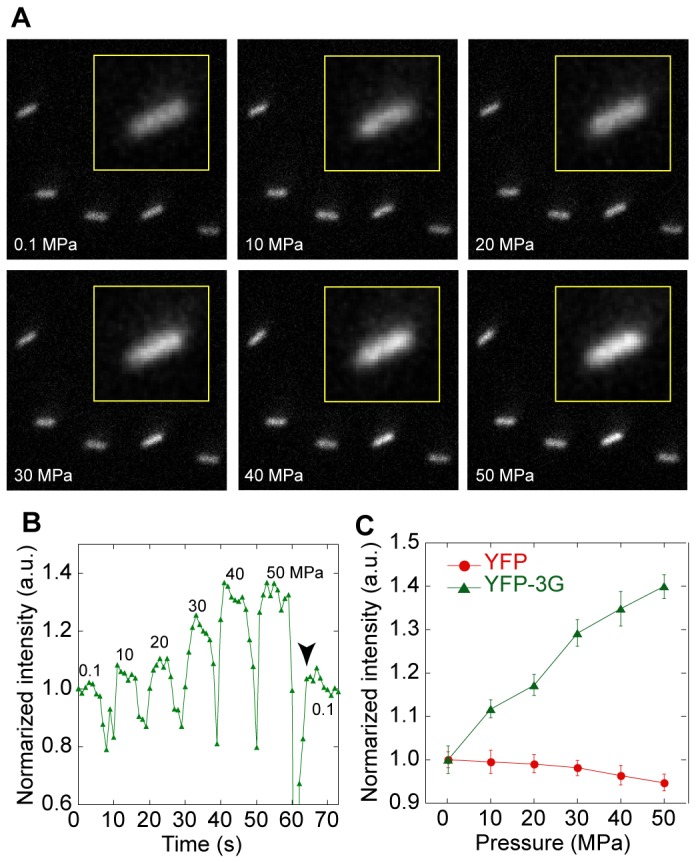
Fluorescent protein-based indicators for intracellular environment conditions such as pH and ion concentrations are commonly used to study the status and dynamics of living cells. Despite being an important factor in many biological processes, the development of an indicator for the physicochemical state of water, such as pressure, viscosity and temperature, however, has been neglected. We here found a novel mutation that dramatically enhances the pressure dependency of the yellow fluorescent protein (YFP) by inserting several glycines into it. The crystal structure of the mutant showed that the tyrosine near the chromophore flipped toward the outside of the β-can structure, resulting in the entry of a few water molecules near the chromophore. In response to changes in hydrostatic pressure, a spectrum shift and an intensity change of the fluorescence were observed. By measuring the fluorescence of the YFP mutant, we succeeded in measuring the intracellular pressure change in living cell. This study shows a new strategy of design to engineer fluorescent protein indicators to sense hydrostatic pressure.
Conflict of interest statement
Figures
Similar articles
-
Glycine insertion modulates the fluorescence properties of Aequorea victoria green fluorescent protein and its variants in their ambient environment.Biophys Physicobiol. 2021 May 21;18:145-158. doi: 10.2142/biophysico.bppb-v18.016. eCollection 2021. Biophys Physicobiol. 2021. PMID: 34178565 Free PMC article.
-
Crystallographic and energetic analysis of binding of selected anions to the yellow variants of green fluorescent protein.J Mol Biol. 2000 Aug 4;301(1):157-71. doi: 10.1006/jmbi.2000.3905. J Mol Biol. 2000. PMID: 10926499
-
A dual reporter system for detecting RNA interactions in bacterial cells.Chembiochem. 2014 Dec 15;15(18):2703-9. doi: 10.1002/cbic.201402322. Epub 2014 Oct 30. Chembiochem. 2014. PMID: 25358737
-
Reducing the environmental sensitivity of yellow fluorescent protein. Mechanism and applications.J Biol Chem. 2001 Aug 3;276(31):29188-94. doi: 10.1074/jbc.M102815200. Epub 2001 May 31. J Biol Chem. 2001. PMID: 11387331
-
Analysis of intracellular pH in the yeast Saccharomyces cerevisiae under elevated hydrostatic pressure: a study in baro- (piezo-) physiology.Extremophiles. 1998 Aug;2(3):223-8. doi: 10.1007/s007920050064. Extremophiles. 1998. PMID: 9783169 Review.
Cited by
-
Glycine insertion modulates the fluorescence properties of Aequorea victoria green fluorescent protein and its variants in their ambient environment.Biophys Physicobiol. 2021 May 21;18:145-158. doi: 10.2142/biophysico.bppb-v18.016. eCollection 2021. Biophys Physicobiol. 2021. PMID: 34178565 Free PMC article.
-
Single-molecule analysis of the rotation of F₁-ATPase under high hydrostatic pressure.Biophys J. 2013 Oct 1;105(7):1635-42. doi: 10.1016/j.bpj.2013.08.036. Biophys J. 2013. PMID: 24094404 Free PMC article.
-
Flowers under pressure: ins and outs of turgor regulation in development.Ann Bot. 2014 Nov;114(7):1517-33. doi: 10.1093/aob/mcu187. Epub 2014 Oct 6. Ann Bot. 2014. PMID: 25288632 Free PMC article. Review.
-
Circularly Permuted Fluorescent Protein-Based Indicators: History, Principles, and Classification.Int J Mol Sci. 2019 Aug 27;20(17):4200. doi: 10.3390/ijms20174200. Int J Mol Sci. 2019. PMID: 31461959 Free PMC article. Review.
-
Design and development of genetically encoded fluorescent sensors to monitor intracellular chemical and physical parameters.Biophys Rev. 2016 Jun;8(2):121-138. doi: 10.1007/s12551-016-0195-9. Epub 2016 Apr 29. Biophys Rev. 2016. PMID: 28510054 Free PMC article. Review.
References
-
- Shimomura O, Johnson FH (1962) Extraction, purification and properties of aequorin, a bioluminescent protein from the luminous hydromedusan. Aequorea. J Cell Comp Physiol 59: 223-239. doi:10.1002/jcp.1030590302. PubMed: 13911999. - DOI - PubMed
-
- Cubitt AB, Heim R, Adams SR, Boyd AE, Gross LA et al. (1995) Understanding, improving and using green fluorescent proteins. Trends Biochem Sci 20: 448-455. doi:10.1016/S0968-0004(00)89099-4. PubMed: 8578587. - DOI - PubMed
-
- Tsien RY (1998) The green fluorescent protein. Annu Rev Biochem 67: 509-544. doi:10.1146/annurev.biochem.67.1.509. PubMed: 9759496. - DOI - PubMed
-
- Nifosí R, Amat P, Tozzini V (2007) Variation of spectral, structural, and vibrational properties within the intrinsically fluorescent proteins family: a density functional study. J Comput Chem 28: 2366-2377. doi:10.1002/jcc.20764. PubMed: 17600852. - DOI - PubMed
-
- Ormö M, Cubitt AB, Kallio K, Gross LA, Tsien RY et al. (1998) Crystal structure of the Aequorea victoria green fluorescent protein. Science 273: 1392-1395. - PubMed
Publication types
MeSH terms
Substances
LinkOut - more resources
Full Text Sources
Other Literature Sources
