. 2013 Aug 27;8(8):e71512.
doi: 10.1371/journal.pone.0071512. eCollection 2013.

Selection of specific protein binders for pre-defined targets from an optimized library of artificial helicoidal repeat proteins (alphaRep)

Affiliations

Selection of specific protein binders for pre-defined targets from an optimized library of artificial helicoidal repeat proteins (alphaRep)

Asma Guellouz et al. PLoS One. .

Abstract

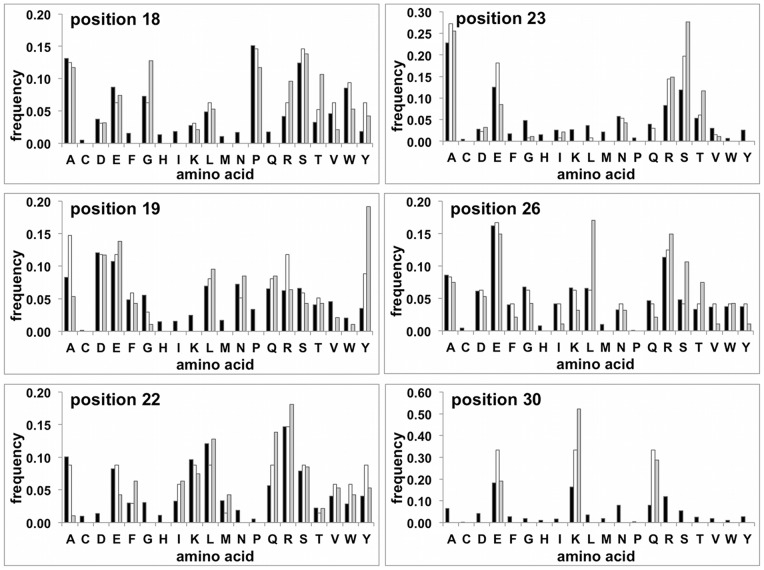
We previously designed a new family of artificial proteins named αRep based on a subgroup of thermostable helicoidal HEAT-like repeats. We have now assembled a large optimized αRep library. In this library, the side chains at each variable position are not fully randomized but instead encoded by a distribution of codons based on the natural frequency of side chains of the natural repeats family. The library construction is based on a polymerization of micro-genes and therefore results in a distribution of proteins with a variable number of repeats. We improved the library construction process using a "filtration" procedure to retain only fully coding modules that were recombined to recreate sequence diversity. The final library named Lib2.1 contains 1.7×10(9) independent clones. Here, we used phage display to select, from the previously described library or from the new library, new specific αRep proteins binding to four different non-related predefined protein targets. Specific binders were selected in each case. The results show that binders with various sizes are selected including relatively long sequences, with up to 7 repeats. ITC-measured affinities vary with Kd values ranging from micromolar to nanomolar ranges. The formation of complexes is associated with a significant thermal stabilization of the bound target protein. The crystal structures of two complexes between αRep and their cognate targets were solved and show that the new interfaces are established by the variable surfaces of the repeated modules, as well by the variable N-cap residues. These results suggest that αRep library is a new and versatile source of tight and specific binding proteins with favorable biophysical properties.


Conflict of interest statement

Competing Interests: The authors have declared that no competing interests exist.

Figures

Figure 1
Figure 1. Sequence diversity of the optimized library (Lib2.1).
The experimental amino acids frequency at each of the 6 randomized positions as compared to the natural and encoded frequencies. Black bars: Amino acid frequencies calculated from the natural collection of αRep like repeats; White bars Frequencies: expected from the coding scheme; Grey bars: experimental diversity observed in library Lib2.1.
Figure 2
Figure 2. Biophysical characterization of the bA3–2, bA3–17 and A3/bA3–2 or bA3–17 complexes. (A–B) Heat denaturation of isolated proteins and complexes as assessed by microcalorimetry (DSC). (Fig. 2–A; O): A3, (0.88 mg mL-1). (Fig. 2–A; Δ): bA3–2, (2.53 mg mL-1). (Fig. 2–A; ▴): mixture A3/bA3–2 (0.88 mg mL-1/0.47 mg mL-1). (Fig. 2–B; O): A3 (0.22 mg mL-1). (Fig. 2–B; □): bA3–17, 0.15 mg mL-1. (Fig. 2–B; ▪): mixture A3/bA3–17 (0.22 mg mL-1/0.15 mg mL-1).
(C-E) A3 interactions with bA3–2 and bA3–17 analyzed by microcalorimetry (ITC). For each ITC experiment, the raw data presented in the upper panel have been integrated in order to obtain the saturation curve presented in the lower panel. Parameters of each binding reaction, Kd and stoichiometry (n) are shown under the corresponding panel. Fig. 2–C (▪): Calorimetric titrations of binder bA3–2 (30 μM;) with A3 (350 μM). (+): experimental data corresponding to direct injection of A3 (390 μM) in the buffer. (□): binding specificity tested by titration of bA3–2 (30 μM) with NCS-wt (350 μM) as an irrelevant target. Fig. 2–D (▪): Calorimetric titrations of binder bA3–17 (30 μM) with A3 (350 μM). (□): binding specificity tested by titration of bA3–17 (30 μM) with NCS-wt (350 μM) as an irrelevant target.Fig. 2–E (▪): A3-binding specificity was evaluated by ITC analysis of the mixture of A3 (390 μM) and irrelevant substrate bNCS-16 (25 μM). (F–H) Size Exclusion Chromatography Solutions of proteins (100 μL of proteins) were injected into an analytical Superdex 75 (10/300) column equilibrated in PBS. Fig. 2–F: A3 and bA3–2. (O): elution profile of A3 alone (2.5 nmol). (Δ) elution profile of bA3–2 alone (4.5 nmol). (▴): SEC Elution profile of the ITC- mixture of A3 (2.5 nmol) and the binder bA3–2 (8.4 nmol).Fig. 2–G: A3 and bA3–17. (O): elution profile of A3 alone (2.5 nmol). (□): elution profile of bA3–17 alone (3 nmol). (▪): SEC elution profile of the ITC-mixture of A3 (2.5 nmol) and the binder bA3–17 (8.4 nmol). Fig.2–H: A3 and the irrelevant protein bNCS-16. (O): elution profile of A3 alone (2.5 nmol). (☆): elution profile of the bNCS-16 alone (4 nmol). (•): SEC elution profile of the ITC-mixture of A3 (2.5 nmol) and the irrelevant binder bNCS-16 (6 nmol).
Figure 3
Figure 3. Calorimetric data for competition binding experiments.
ITC titration of a mixture of A3 (25 μM) pre-bound to bA3–17 (43 μM) with bA3–2 (350 μM). In these conditions, the apparent binding constant for bA3–2 decreases within the range required for ITC. Determination of the Kapp is given by: Kapp  = Ka bA3–2/(1+ Ka bA3–17 [bA3–17]). ΔHbA3–17 and Ka bA3–17 used in the data analysis had been determined in Fig. 2–B.
Figure 4
Figure 4. Biophysical characterization of the bNCS-16 and NCS-3.24/bNCS-16 complex.
Fig. 4–A: Heat denaturation of binder/target (bNCS-16/NCS-3.24) pair assessed by DSC. (): NCS-3.24 (0.13 mg mL−1). (☆): selected bNCS-16, 0.15 mg mL−1. (★) mixture NCS-3.24/bNCS-16 (0.13 mg mL−1/.0.15 mg mL−1). Fig. 4–B: Heat denaturation of bNCS-16/NCS-wt assessed by DSC. (): NCS-wt. (☆): bNCS-16 (0.15 mg mL−1). (◂) mixture NCS-wt/bNCS-16 (0.13 mg mL−1/0.15 mg mL−1). Fig. 4–C: ITC calorimetric titrations of binder bNCS-16 (20 μM) with NCS-3.24 (211 μM). Fig. 4–D: The NCS-3.24-binding specificity was evaluated by ITC analysis of injection of NCS-wt (350 μM) in a solution of bNCS-16 (44.5 μM). (E–F) Size Exclusion Chromatography (Superdex 75 10/300.) of the selected bNCS-16 with NCS-3.24 (E) or NCS-wt (F). Fig. 4–E. (☆): elution profile of the bNCS-16 alone (4 nmol). (): elution profile of the NCS-3.24 alone (1.25 nmol). (★): SEC Elution profile of the ITC- mixture of NCS-3.24 (8.4 nmol) and the binder bNCS-16 (4.8 nmol). Fig. 4–F. (): elution profile of the NCS-wt alone (5 nmol). (☆): elution profile of the bNCS-16 alone (4 nmol). (◂): SEC elution profile of the ITC-mixture of NCS-wt (14 nmol) and the binder bNCS-16 (10.7 nmol).
Figure 5
Figure 5. Biophysical characterization of the bGFP-A and GFP/bGFP-A complex.
(A) ITC calorimetric titrations. Concentrations values are expressed in monomer concentrations. (▪): Tiration of GFP (35 μM) with bGFP-A (350 μM). (□): The bGFP-A binding specificity was tested by titration with NCS-wt (bGFP-A 30 μM, NCS-wt 350 μM). (B) The GFP-binding specificity was evaluated by ITC analysis of injection of bA3–1 (360 μM) in a solution of GFP (30 μM). (C) Size Exclusion Chromatography (Superdex 75 10/300) of the selected bGFP-A and GFP. (▾): SEC Elution profile of a mixture of GFP (2.25 nmol) and the binder bGFP-A (6.75 nmol). (∇): elution profile of the bGFP-A alone (2.25 nmol). (formula image
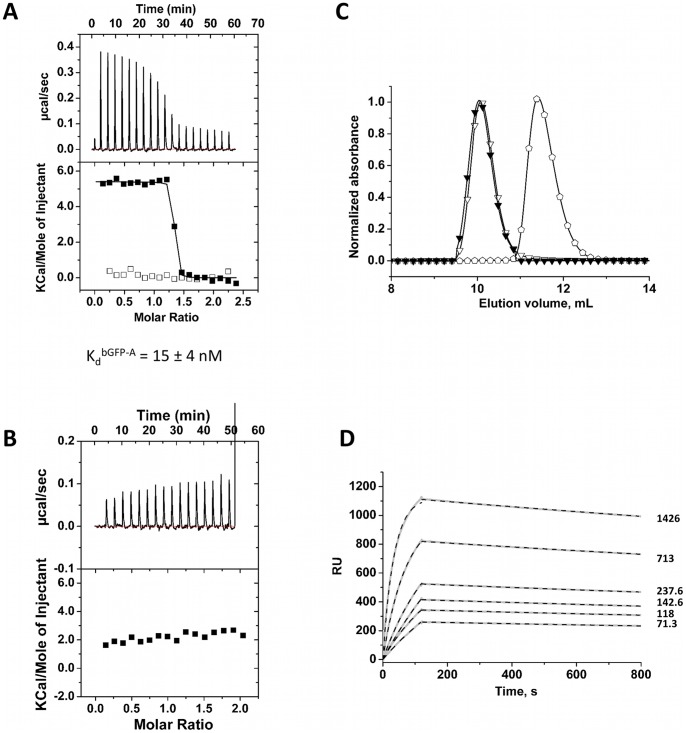
): elution profile of the GFP alone (6.75 nmol). (D) Affinity determination of selected bGFP-A using SPR. Different concentrations of bGFP-A (71,3; 118; 142,6; 237,6; 713; 1426 nM) were applied to flow cell with immobilized biotinylated EGFP for 120 s followed by washing buffer flow. The sensorgrams were corrected for non-specific binding by subtraction of a channel without EGFP bound (grey curve). The fits of kon and koff rates are indicated by black dashed line. Kd values were computed using koff  = 1.7×10⁻⁴ s−1 for all concentrations and kon  = 4.3, 4, 2.2, 2.6, 2, 2×10⁴M−1 s−1 for the increasing concentrations respectively.
Figure 6
Figure 6. Biophysical characterization of the bEbs1-6 and Ebs1/bEbs1–6 complex.
(A) ITC calorimetric titrations. (▪): Titration of Ebs1 (35 μM) with bEbs1–6 (387 μM). (□): The bEbs1–6 (30 μM) binding specificity was tested by titration with NCS-wt (350 μM). (B) Size Exclusion Chromatography (Superdex 200 prep grade Hiload 16/60) of the selected bEbs1–6 and Ebs1 (?):SEC elution profile of bEbs1–6 alone; (∇): elution profile of Ebs1 alone; (?): elution profile of an equimolar mixture of Ebs1 (55 nmol) and the binder bEbs1–6 (55 nmol).
Figure 7
Figure 7. Representation of the bA3–2/A3 complex.
(A) Ribbon representation of the bA3–2/A3 complex. A3 is represented in light blue (Ncap in grey and C-cap in deep blue). bA3–2 is in green. (B) Representation of the interface between bA3–2 and A3 proteins (same colour code as panel A). Residues involved in the interaction are shown as sticks. Residues from the interface, which belong to the invariant scaffold of αRep proteins, are shown as ball and sticks. Hydrogen bonds are depicted by dashed lines. (C) Modelisation of a canonical bA3–2 C-cap (magenta) in the structural context of the complex. (D) Modelisation of an additional HEAT repeat module and of a C-cap (magenta) in the structure of the αRep protein bound to A3.
Figure 8
Figure 8. Representation of the bNCS-16/NCS-3.24 complex.
(A) Ribbon representation of the two bNCS-16/NCS-3.24 complexes present in the asymmetric unit. (B) Comparison of the NCS-3.24/testosterone complex (NCS-3.24 is in grey and testosterone hemisuccinate are in blue) with the bNCS-16/NCS-3.24 complex (same colour code as panel A). For clarity, only loops from NCS-3.24 that undergo conformational changes are shown.(C) Representation of the interface between bNCS-16 and NCS-3.24 (same colour code as panel A). Residues involved in the interaction are shown as sticks. Residues from the interface, which belong to the invariant scaffold of αRep proteins are shown as ball and sticks. Hydrogen bonds are depicted by dashed lines.

Similar articles

Cited by

References

    1. Urvoas A, Valerio-Lepiniec M, Minard P (2012) Artificial proteins from combinatorial approaches. Trends Biotechnol 30: 512–520. - PubMed
    1. Koide S (2009) Generation of new protein functions by nonhomologous combinations and rearrangements of domains and modules. Curr Opin Biotechnol 20: 398–404. - PMC - PubMed
    1. Gilbreth RN, Koide S (2012) Structural insights for engineering binding proteins based on non-antibody scaffolds. Curr Opin Struct Biol 22: 413–420. - PMC - PubMed
    1. Hey T, Fiedler E, Rudolph R, Fiedler M (2005) Artificial, non-antibody binding proteins for pharmaceutical and industrial applications. Trends Biotechnol 23: 514–522. - PubMed
    1. Skerra A (2007) Alternative non-antibody scaffolds for molecular recognition. Curr Opin Biotechnol 18: 295–304. - PubMed

Publication types