. 2013 Oct 24;122(17):3001-9.
doi: 10.1182/blood-2012-12-475087. Epub 2013 Sep 6.

MicroRNA-146a regulates survival and maturation of human plasmacytoid dendritic cells

Affiliations

MicroRNA-146a regulates survival and maturation of human plasmacytoid dendritic cells

Julien J Karrich et al. Blood. .

Abstract

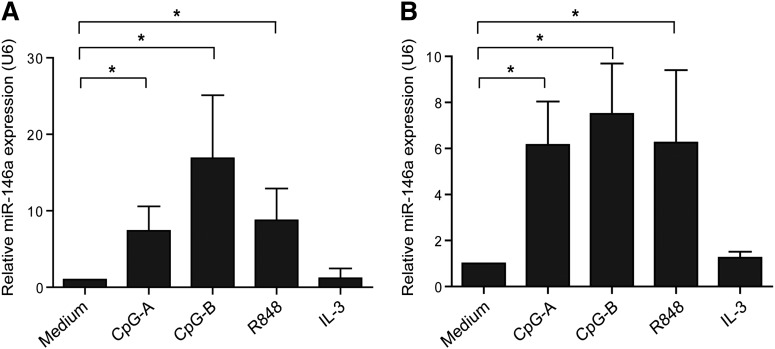
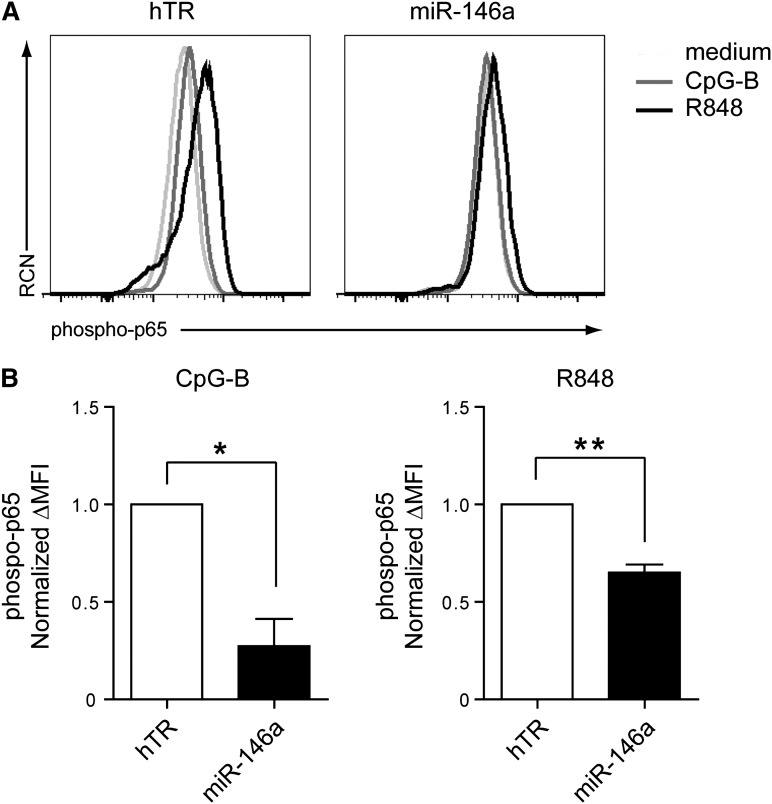
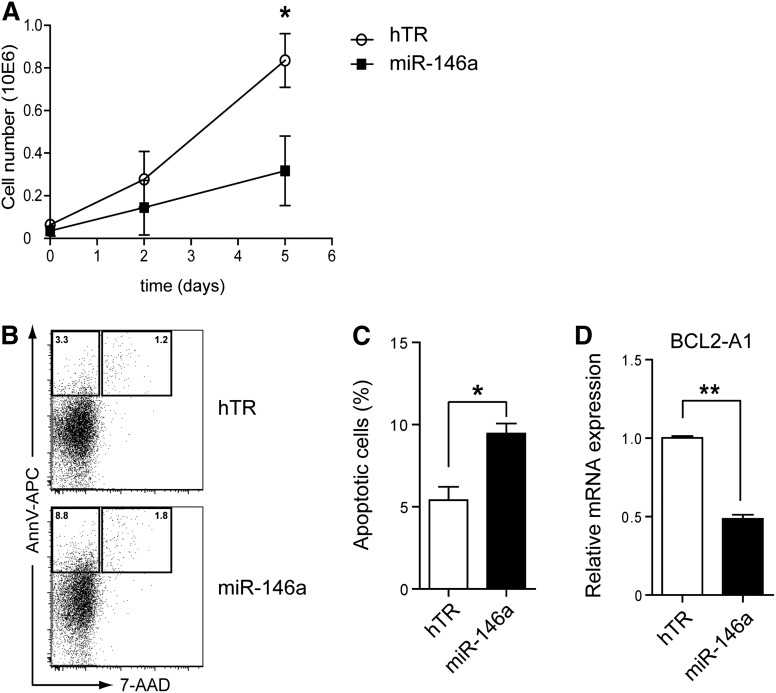
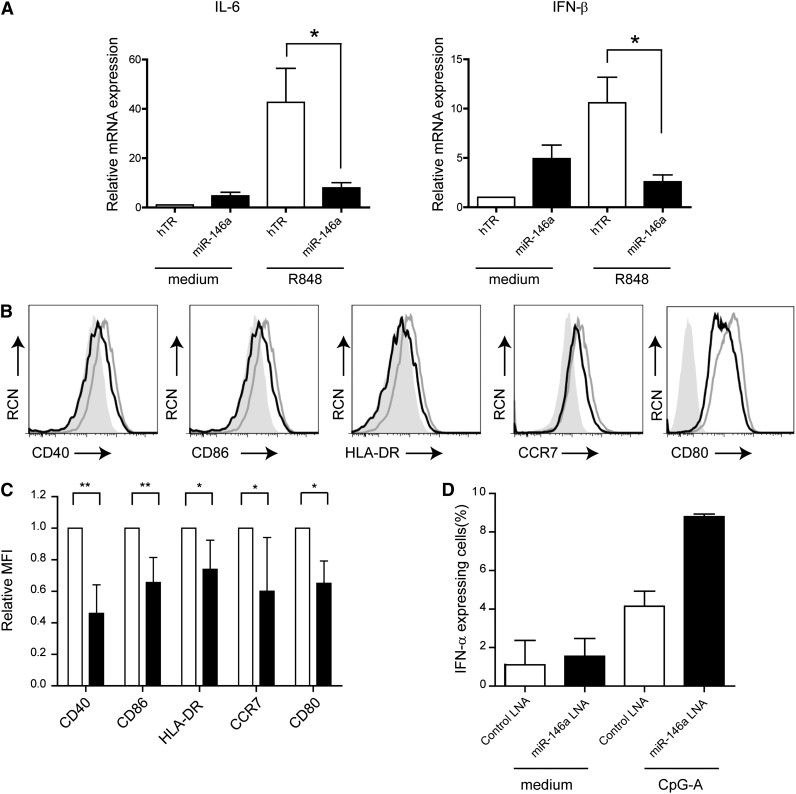
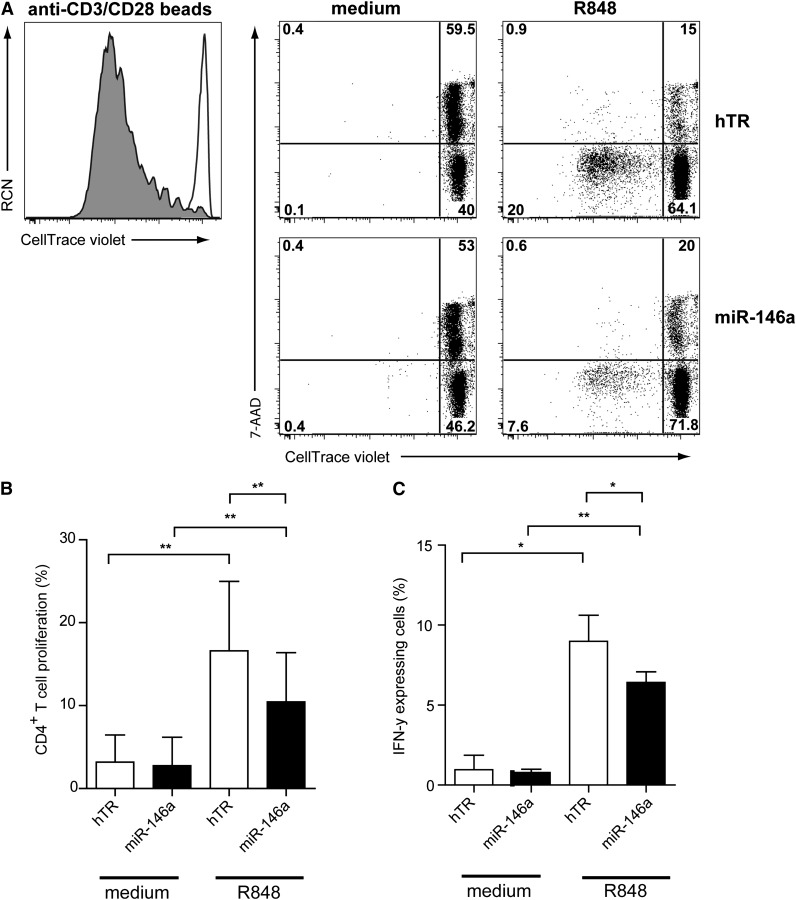
During microbial infections, plasmacytoid dendritic cells (pDCs) are a main source of type I interferons α/β (IFN-α/-β). Nucleic acids from microbes are sensed by Toll-like receptors 7/9 (TLR7/9), which are selectively expressed in pDCs. Activated pDCs also produce proinflammatory cytokines and upregulate costimulatory molecules. Together, this equips pDCs with the ability to prime T, B, and NK cells and conventional DCs, thereby initiating adaptive immune responses. To avoid deleterious effects to the host, tight regulation of pDC activation is required. Despite data linking aberrant activation of pDCs with autoimmune diseases, little is known about mechanisms controlling pDC activation. Here, we investigated the role of microRNA-146a (miR-146a) in TLR pathway regulation in human pDCs. MiR-146a expression was induced upon TLR7/9 signaling. Furthermore, ectopic miR-146a expression effectively impaired TLR-mediated signaling in pDCs as TLR-induced nuclear factor-κB activation was reduced. This consequently diminished the production of proinflammatory cytokines and reduced pDC survival. Moreover, miR-146a-expressing pDCs had decreased ability to induce CD4(+) T-cell proliferation likely due to reduced expression levels of major histocompatibility complex class II and costimulatory molecules. Our data unravel the crucial immunomodulatory role of miR-146a in pDCs and may add to our understanding of aberrant responses in autoimmune diseases.


Figures

Figure 1
Figure 1
MiR-146a is upregulated upon activation of pDCs. (A) Freshly isolated pDCs or (B) CAL-1 cells were activated with the TLR9 agonists CpG-A or CpG-B, the TLR7 agonist R848 (each 10 μg/mL), IL-3 (10 ng/mL), or cultured in medium alone for 16 hours. The relative expression of the mature form of miR-146a was assessed by QPCR using specific TaqMan primers and the QPCR TaqMan kit. MiR-146a levels were normalized to the level of the small nuclear RNA U6, and the medium control condition was set to 1. Data are shown as means ± SD of independent pDC donors (CpG-A, n = 5; CpG-B, n = 4; R848, n = 5; IL-3, n = 2) or independent experiments using CAL-1 cells (CpG-A and CpG-B, n = 3; R848 and IL-3, n = 4). *P < .05.
Figure 2
Figure 2
Overexpression of miR-146a in CAL-1 cells blocks TLR-induced NF-κB activation. (A) Flow cytometric analysis of phospho-p65 levels after intracellular staining of CAL-1 cells. CAL-1 cells were transduced with miRNA-146a or with control hTR-expressing vectors, which also drive expression of the marker GFP. Levels of phosphorylation of the NF-κB subunit p65 were measured in GFP-sorted transduced cells after activation for 15 minutes with 10 μg/mL CpG-B (dark gray line), 10 μg/mL R848 (black line), or medium as control (light gray line). RCN, relative cell number. (B) Statistical analysis of phospo-p65 levels was assessed by plotting the difference in mean fluorescence intensity (ΔMFI) between activated cells and medium-cultured cells of 4 different experiments. Data are normalized to phospho-p65 levels in activated hTR-transduced cells, which was set to 1. *P = .014; **P = .004.
Figure 3
Figure 3
MiR-146a overexpression induces apoptosis of CAL-1 cells. (A) CAL-1 cells were transduced with hTR control RNA (open symbols) or miR-146a (closed symbols) and cultured in medium. GFP expression was determined at the indicated days by flow cytometry. Shown are the absolute numbers of GFP+ CAL-1 cells. (B) GFP+ cells were sorted and cultured for 2 days. Cells were stained with Annexin V and 7-AAD to assess for apoptosis. Numbers in the dot plots represent percentages of cells that fall within the indicated gates. (C) The percentages of apoptotic cells were determined as in panel B. Shown are mean percentages ± SD of 3 independent experiments (*P < .05). (D) QPCR analysis of BCL2-A1 mRNA levels in CAL-1 cells transduced with hTR control or with miR-146a. Expression levels in hTR-transduced CAL-1 cells were set to 1. Shown are mean values ± SD of an analysis of QPCR done in triplicate. This is a representative experiment of 4. **P < .01.
Figure 4
Figure 4
Ectopic miR-146a expression affects pDC activation and maturation. (A) QPCR analysis of IL-6 and IFN-β mRNA levels in CAL-1 cells transduced with hTR control or with miR-146a cultured in medium or activated with TLR7 ligand R848 (10 μg/mL) for 4 hours. Shown are mean values ± SD of 2 independent experiments. The values for hTR-transduced cells cultured in medium are set to 1. *P < .05. (B) Flow cytometric analysis of CAL-1 cells after transduction with hTR control (gray line) or miR-146a (black line). Cells were activated overnight with the TLR7 ligand R848 and stained for expression of CD40, CD80, CD86, HLA-DR, and CCR7. The filled gray histograms represent isotype control antibody-stained cells. RCN, relative cell number. (C) Cells were analyzed as in panel B. Statistical analysis of the relative MFIs ± SD of 4 to 6 different experiments. MFIs of proteins expressed on hTR control cells are set to 1. *P < .05; **P < .01. (D) Primary pDCs isolated from blood were transfected with FITC-conjugated LNA-miR146a or LNA-control followed by activation with CpG-A (10 μg/mL) or medium only for 18 hours. Cells were analyzed by flow cytometry after staining with an anti–IFN-α antibody or isotype control antibody. Shown are the mean percentages ± SD of IFN-α–expressing pDCs of 2 independent experiments.
Figure 5
Figure 5
MiR-146a inhibits CD4+ T-cell proliferation induced by TLR7-preactivated CAL-1 cells. (A) Flow cytometric analysis of T-cell proliferation induced by CAL-1 cells transduced with hTR control RNA or with miR-146a–expressing vectors that were preactivated for 48 hours with or without TLR7 agonist R848 (10 μg/mL). Preactivated CAL-1 cells were cocultured together with freshly isolated allogeneic CD4+ T cells (ratio CAL-1:CD4+ T cells = 1:1) after labeling with the CellTrace Violet membrane dye. After 6 days, T cells were analyzed for expression of CellTrace Violet and 7-AAD in CD3+ T cells. Percentages of CellTrace-Violetlo7-AADCD3+ cells represent T cells that proliferated and are alive (lower left quadrant). CD4+ T cells activated with anti-CD3/CD28 beads are shown as a positive control for proliferation (gray histogram) as compared with CD4+ T cells cultured only with medium (white histogram). Shown is 1 representative experiment of 3. Numbers in plots represent percentages of cells that fall within the indicated quadrant. (B) Cells were analyzed as in panel A. Statistical analysis of CD4+ T-cell proliferation of 3 independent experiments. Only the mean percentages ± SD of CellTrace-Violetlo7-AADCD3+ T cells are depicted. *P < .05. (C) After 6 days of coculture, CD4+ T cells were restimulated with PMA/ionomycin for 6 hours in the presence of Brefeldin A and analyzed by flow cytometry for IFN-γ expression. Shown are the mean percentages of IFN-γ+ T cells of 1 representative of 3 independent experiments. Error bars indicate SD values of measurements done in triplicate.

Similar articles

Cited by

References

    1. Liu YJ. IPC: professional type 1 interferon-producing cells and plasmacytoid dendritic cell precursors. Annu Rev Immunol. 2005;23:275–306. - PubMed
    1. Kadowaki N, Antonenko S, Lau JY, Liu YJ. Natural interferon alpha/beta-producing cells link innate and adaptive immunity. J Exp Med. 2000;192(2):219–226. - PMC - PubMed
    1. Lande R, Gilliet M. Plasmacytoid dendritic cells: key players in the initiation and regulation of immune responses. Ann N Y Acad Sci. 2010;1183:89–103. - PubMed
    1. Gilliet M, Cao W, Liu YJ. Plasmacytoid dendritic cells: sensing nucleic acids in viral infection and autoimmune diseases. Nat Rev Immunol. 2008;8(8):594–606. - PubMed
    1. Hayden MS, West AP, Ghosh S. NF-kappaB and the immune response. Oncogene. 2006;25(51):6758–6780. - PubMed

Publication types

MeSH terms