

Circadian measurements of sirtuin biology
- PMID: 24014414
- PMCID: PMC4090050
- DOI: 10.1007/978-1-62703-637-5_19
Circadian measurements of sirtuin biology
Abstract
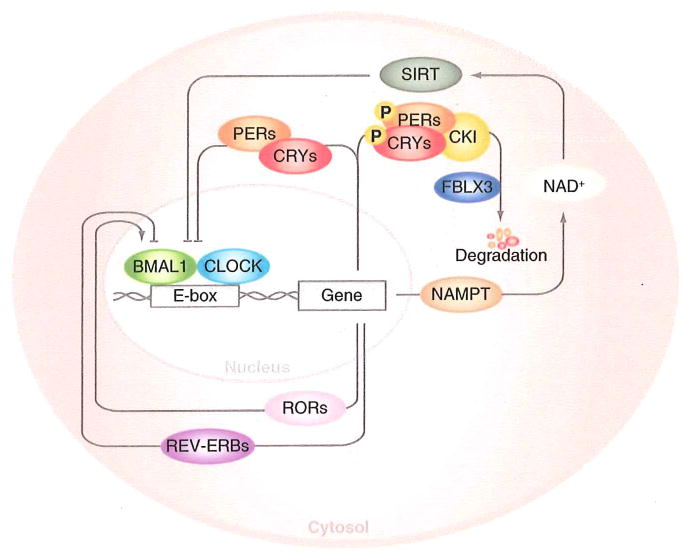
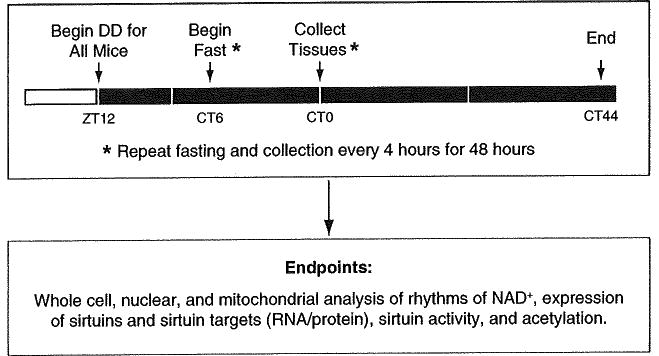
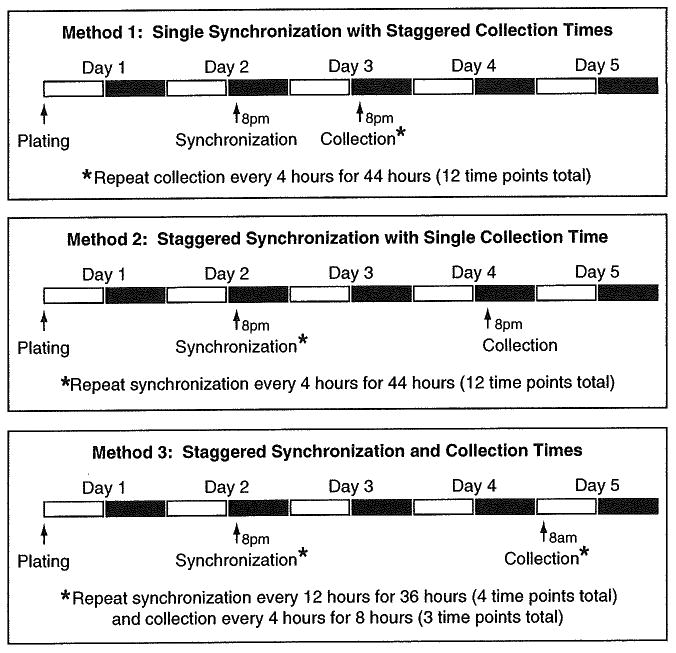
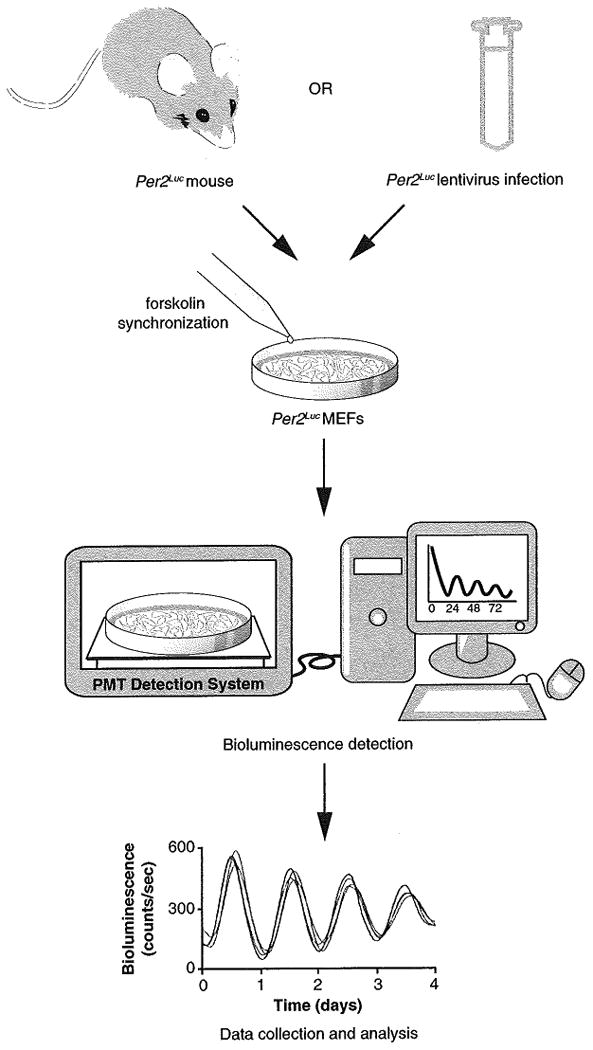
Many of our behavioral and physiological processes display daily oscillations that are under the control of the circadian clock. The core molecular clock network is present in both the brain and peripheral tissues and is composed of a complex series of interlocking transcriptional/translational feedback loops that oscillate with a periodicity of ~24 h. Recent evidence has implicated NAD(+) biosynthesis and the sirtuin family of NAD(+)-dependent protein deacetylases as part of a novel feedback loop within the core clock network, findings which underscore the importance of taking circadian timing into consideration when designing and interpreting metabolic studies, particularly in regard to sirtuin biology. Thus, this chapter introduces both in vivo and in vitro circadian methods to analyze various sirtuin-related endpoints across the light-dark cycle and discusses the transcriptional, biochemical, and physiological outputs of the clock.
Figures
Similar articles
-
Circadian NAD(P)(H) cycles in cell metabolism.Semin Cell Dev Biol. 2022 Jun;126:15-26. doi: 10.1016/j.semcdb.2021.07.008. Epub 2021 Jul 17. Semin Cell Dev Biol. 2022. PMID: 34281771 Free PMC article. Review.
-
"Clocks" in the NAD World: NAD as a metabolic oscillator for the regulation of metabolism and aging.Biochim Biophys Acta. 2010 Aug;1804(8):1584-90. doi: 10.1016/j.bbapap.2009.10.024. Epub 2009 Nov 6. Biochim Biophys Acta. 2010. PMID: 19897060 Free PMC article. Review.
-
Circadian control of the NAD+ salvage pathway by CLOCK-SIRT1.Science. 2009 May 1;324(5927):654-7. doi: 10.1126/science.1170803. Epub 2009 Mar 12. Science. 2009. PMID: 19286518 Free PMC article.
-
Senescence of Timing Reverted: NAD+ Rejuvenates the Circadian Clock.Mol Cell. 2020 Jun 4;78(5):805-807. doi: 10.1016/j.molcel.2020.05.010. Mol Cell. 2020. PMID: 32502419
-
Metabolic regulation of circadian clocks.Semin Cell Dev Biol. 2013 May;24(5):414-21. doi: 10.1016/j.semcdb.2013.03.007. Epub 2013 Mar 26. Semin Cell Dev Biol. 2013. PMID: 23538134 Review.
Cited by
-
Upregulation of GPR109A in Parkinson's disease.PLoS One. 2014 Oct 17;9(10):e109818. doi: 10.1371/journal.pone.0109818. eCollection 2014. PLoS One. 2014. PMID: 25329911 Free PMC article.
-
CosinorPy: a python package for cosinor-based rhythmometry.BMC Bioinformatics. 2020 Oct 29;21(1):485. doi: 10.1186/s12859-020-03830-w. BMC Bioinformatics. 2020. PMID: 33121431 Free PMC article.
-
Circadian rhythm genes CLOCK and PER3 polymorphisms and morning gastric motility in humans.PLoS One. 2015 Mar 16;10(3):e0120009. doi: 10.1371/journal.pone.0120009. eCollection 2015. PLoS One. 2015. PMID: 25775462 Free PMC article.
References
-
- Maron BJ, Kogan J, Proschan MA, Hecht GM, Roberts WC. Circadian variability in the occurrence of sudden cardiac death in patients with hypertrophic cardiomyopathy. J Am Coll Cardiol. 1994;23(6):1405–1409. pii: 0735-1097 (94)90384-0. - PubMed
-
- Di Lorenzo L, De Pergola G, Zocchetti C, L'Abbate N, Basso A, Pannacciulli N, Cignarelli M, Giorgino R, Soleo L. Effect of shift work on body mass index: results of a study performed in 319 glucose-tolerant men working in a Southern Italian industry. Int J Obes Relat Metab Disord. 2003;27(11):1353–1358. doi: 10.1038/sj.ijo.0802419. pii: 0802419. - DOI - PubMed
MeSH terms
Substances
Grants and funding
LinkOut - more resources
Full Text Sources
Other Literature Sources
