. 2014 May;35(5):2027-43.
doi: 10.1002/hbm.22310. Epub 2013 Sep 3.

Event-related fMRI at 7T reveals overlapping cortical representations for adjacent fingertips in S1 of individual subjects

Affiliations

Event-related fMRI at 7T reveals overlapping cortical representations for adjacent fingertips in S1 of individual subjects

Julien Besle et al. Hum Brain Mapp. 2014 May.

Abstract

Recent fMRI studies of the human primary somatosensory cortex have been able to differentiate the cortical representations of different fingertips at a single-subject level. These studies did not, however, investigate the expected overlap in cortical activation due to the stimulation of different fingers. Here, we used an event-related design in six subjects at 7 Tesla to explore the overlap in cortical responses elicited in S1 by vibrotactile stimulation of the five fingertips. We found that all parts of S1 show some degree of spatial overlap between the cortical representations of adjacent or even nonadjacent fingertips. In S1, the posterior bank of the central sulcus showed less overlap than regions in the post-central gyrus, which responded to up to five fingertips. The functional properties of these two areas are consistent with the known layout of cytoarchitectonically defined subareas, and we speculate that they correspond to subarea 3b (S1 proper) and subarea 1, respectively. In contrast with previous fMRI studies, however, we did not observe discrete activation clusters that could unequivocally be attributed to different subareas of S1. Venous maps based on T2*-weighted structural images suggest that the observed overlap is not driven by extra-vascular contributions from large veins.

Keywords: High-resolution functional MRI; Human; Somatosensory cortex; Tactile Perception.


Figures

Figure 1
Figure 1
Registration and identification of veins using T2*‐weighted magnitude and phase images. A: Example T2*‐weighted anatomical image with same slice prescription and coverage as functional data (B,C,D), but improved in‐plane spatial resolution (0.25 × 0.25 mm2). Note that the anatomical images are not subject to the same geometric distortions as the functional EPI images. B: Mean EPI (T2*‐weighted) functional image with no registration applied, highlighting large regions of mismatch due to geometric distortions; C: after affine registration (FSL/FLIRT), which improves correspondence; D: following non‐rigid registration of mean functional image to anatomical image using FNIRT, showing a close match. Red line, trace of gray matter cortical surface from high‐resolution T2*‐weighted anatomical image. E. Example T2*‐weighted phase image (same subject, slice and resolution as A). Phase images are unwrapped (F) and high‐pass filtered (G) in order to emphasize abrupt phase changes corresponding to changes in magnetic susceptibility in and around veins. H: A map of veins is approximated by thresholding the unwrapped, filtered phase image and convolving the identified voxels with a 2 mm kernel. [Color figure can be viewed in the online issue, which is available at http://wileyonlinelibrary.com.]
Figure 2
Figure 2
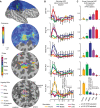
A: Localization of S1 and definition of fingertip‐specific ROIs using the phase‐encoding paradigm (data from subject 1). Coherence maps, phase maps and ROIs are displayed on inflated 3D model of the right hemisphere cortical surface (top) and flattened cortical patch (bottom 3 maps). Dark gray, areas of negative curvature (sulci); light gray, areas of positive curvature (gyri); shaded area on the 3D model, location of the cortical flat patch. The scale was estimated from the length along the cortical surface of a straight line drawn on the flattened patch. Coherence values are the maximum intensity projection of coherence across coordinates corresponding to different cortical depths. Note that not all surface points of the patch have an associated value, because of the partial FOV of the functional images as shown in blue. Phase maps for the corresponding dataset are thresholded at a coherence value of 0.25. Phase values (in radians) and corresponding preferred stimulus location (fingertip) are shown. Phase values are displayed at a relative cortical depth of 0.8 (where 0 is the white/gray matter interface and 1.0 the pial surface). Fingertip‐specific ROIs (bottom) are defined as all contiguous voxels within a given phase‐interval, over a coherence threshold of 0.25 and within the cortical sheet. The black outline indicates the volume in which the event‐related analysis was performed to limit the number of multiple comparisons (constructed by expanding the 5 fingertip ROIs by 5 voxels in 3D space). B: Estimated HRF from the deconvolution GLM for each stimulation condition for subject 1, averaged across voxels of each ROI. Error bars, voxel‐wise parameter standard errors averaged across voxels of each ROI (preferred fingertip condition only). C: Parameter estimates of the magnitude component from canonical HRF GLM fit for each stimulation condition, averaged across voxels of each ROI and across all subjects (N = 6). Error bars, standard error of the ROI‐averaged parameters across subjects. The two‐way interaction between ROIs and fingertip stimulation was highly significant (see text). Symbols, statistical significance of each factor combination compared to zero, adjusted for multiple testing across all combinations (see Material and Methods section). [Color figure can be viewed in the online issue, which is available at http://wileyonlinelibrary.com.]
Figure 3
Figure 3
Maps of overlapping activation for event‐related data. A. Parameter estimate maps for the magnitude component of each stimulation condition in the canonical HRF GLM analysis for subject 2, displayed on a flattened cortical patch. Saturation of each colour map represents the amplitude of the parameter estimate. Transparency represents the corresponding statistical significance (thresholded at P‐value < 0.05, FWE‐adjusted). Shaded area, voxels included in the analysis. B. Parameter estimate maps for adjacent fingers (subject 2, P < 0.05 FWE‐adjusted) superimposed using additive colour blending scheme described in Material and Methods. Voxels activated by adjacent finger stimulation conditions are shown in intermediate colours (see colour legend). C. Parameter estimate maps for all five fingertips superimposed using additive colour blending (P < 0.05 FWE‐adjusted), each row shows data from one subject. Colours identical to panel B, but voxels activated by more than two fingertips are shown in de‐saturated (whiter) shades. Second row shows subject 2 as shown in panels A and B. Dashed line indicates a change in the specificity of voxels: voxels anterior to the line show a higher degree of specificity (less overlap). D. As for C, but with the less conservative threshold FDR‐adjusted P < 0.05. A higher degree of specificity can still be seen in the posterior bank of the central sulcus. [Color figure can be viewed in the online issue, which is available at http://wileyonlinelibrary.com.]
Figure 4
Figure 4
Specificity and activation overlap in the anterior and posterior parts of the ROIs. Note that the anterior part of the ROIs shows a higher degree of specificity. A: ROIs defined from the phase‐encoding dataset (see Fig. 2A for details) and divided into anterior and posterior parts based on the event‐related activation map overlap, as illustrated in Figure 3C,D. B: Parameter estimates for each of the 5 fingertip stimulation regressors (magnitude component), averaged across voxels in each of the 5 posterior and 5 anterior ROIs defined as in panel A (averaged across subjects). Error bars, standard error across subjects. Other conventions as in Figure 2. The three‐way interaction between fingertip ROI, anterior/posterior ROI and fingertip stimulation was significant. C: Proportion of voxels of the phase‐encoding ROIs significantly active in response to only 1, only 2, only 3, only 4 or all fingertip stimulations in the canonical HRF GLM analysis of the ER experiment, plotted as a function of the statistical threshold. Statistical thresholds on the x‐axis are expressed as a Z score corresponding to an FDR‐adjusted P value. Data averaged across 6 subjects. Error bars, standard error across subjects. The average number of voxels across subjects was 251 ± 13 (SEM) for anterior ROIs and 296 ± 27 for posterior ROIs. [Color figure can be viewed in the online issue, which is available at http://wileyonlinelibrary.com.]
Figure 5
Figure 5
Activation maps at superficial (i.e., near pial surface] and deeper (i.e., near the boundary with white matter] cortical depths and comparison with vein maps. A: Map of voxels near the surface of the cortex identified as being within 0.5 mm of a large vein. This flat map corresponds to voxels in the upper 10% of the segmented gray matter. Veins were identified using the T2*‐weighted phase images (see Fig. 1B and Material and Methods]. B. Superimposed activation maps for the 5 fingertip stimulation conditions (see Fig. 2 for details] at the same cortical depth as A. C. As A for voxels falling in the lower 10% of the segmented gray matter. D. As B for voxels falling in the lower 10% of the segmented gray matter. E. Percentage of voxels identified as significantly active within the anterior (left) or posterior (right) phase‐encoding ROIs, excluding voxels in the vicinity of large veins, as a function of the statistical threshold (for details, see Fig. 4C]. The average number of such voxels across subjects was 214 ± 7 (SEM) for anterior ROIs and 244 ± 23 for posterior ROIs, representing, respectively, 86 and 82% of voxels in these ROIs. F. As E, but in this case only including voxels found in the vicinity of large veins. The average number of such voxels was 36 ± 6 for anterior ROIs and 52 ± 8 for posterior ROIs, representing, respectively, 14 and 18% of voxels in these ROIs. [Color figure can be viewed in the online issue, which is available at http://wileyonlinelibrary.com.]

References

    1. Andersson JLR, Jenkinson M, Smith SM (2007): Nonlinear registration, aka Spatial normalisation.
    1. Benjamini Y, Hochberg Y (1995): Controlling the false discovery rate: A practical and powerful approach to multiple testing. J Royal Stat Soc B (Methodological) 57:289–300.
    1. Benjamini Y, Krieger AM, Yekutieli D (2006): Adaptive linear step‐up procedures that control the false discovery rate. Biometrika 93:491–507.
    1. Besle J, Sanchez‐Panchuelo RM, Bowtell R, Francis S, Schluppeck D: Single‐subject fMRI mapping at 7T of the representation of fingertips in S1: A comparison of event‐related and phase‐encoding designs. J Neurophysiol (in press). - PMC - PubMed
    1. Biermann K, Schmitz F, Witte OW, Konczak J, Freund HJ, Schnitzler A (1998): Interaction of finger representation in the human first somatosensory cortex: a neuromagnetic study. Neurosci Lett 251:13–16. - PubMed

Publication types

LinkOut - more resources