Review
. 2013 Sep-Oct;2(5):701-21.
doi: 10.1002/wdev.111. Epub 2013 Feb 11.

Initial neurogenesis in Drosophila

Affiliations
Review

Initial neurogenesis in Drosophila

Volker Hartenstein et al. Wiley Interdiscip Rev Dev Biol. 2013 Sep-Oct.

Erratum in

  • Wiley Interdiscip Rev Dev Biol. 2013 Nov-Dec;2(6):823
  • Initial neurogenesis in Drosophila.
    Hartenstein V, Wodarz A. Hartenstein V, et al. Wiley Interdiscip Rev Dev Biol. 2013 Nov;2(6):823. doi: 10.1002/wdev.117. Epub 2013 Mar 22. Wiley Interdiscip Rev Dev Biol. 2013. PMID: 29393596 No abstract available.

Abstract

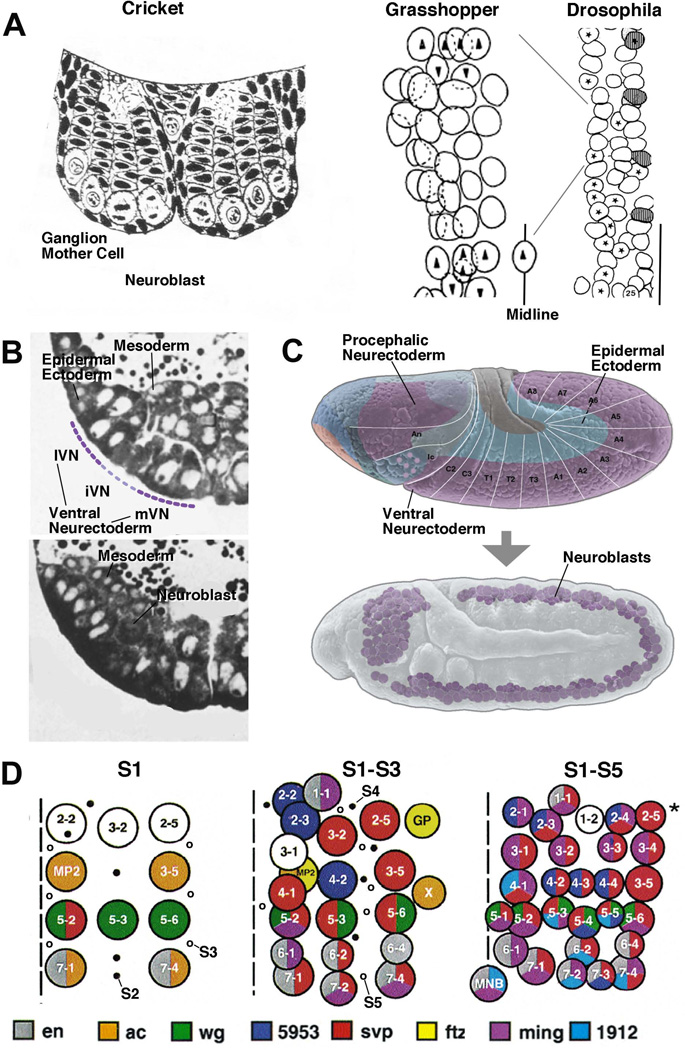
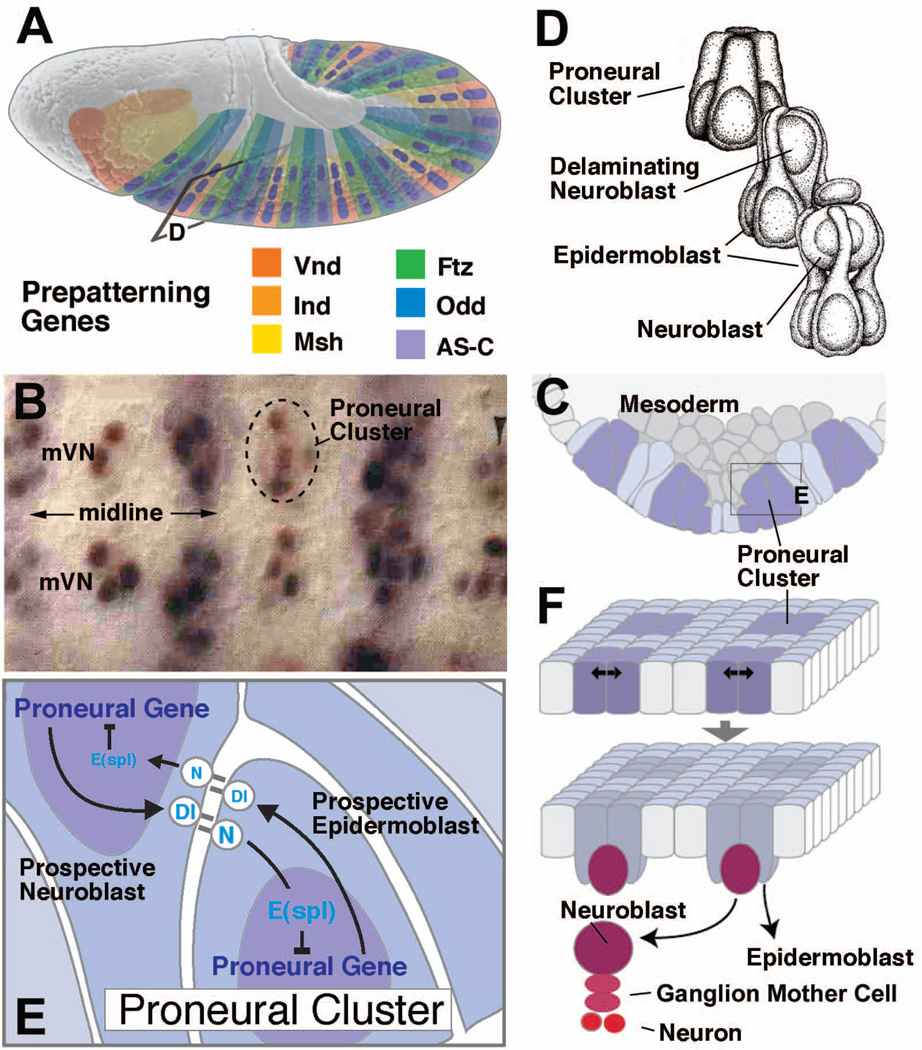
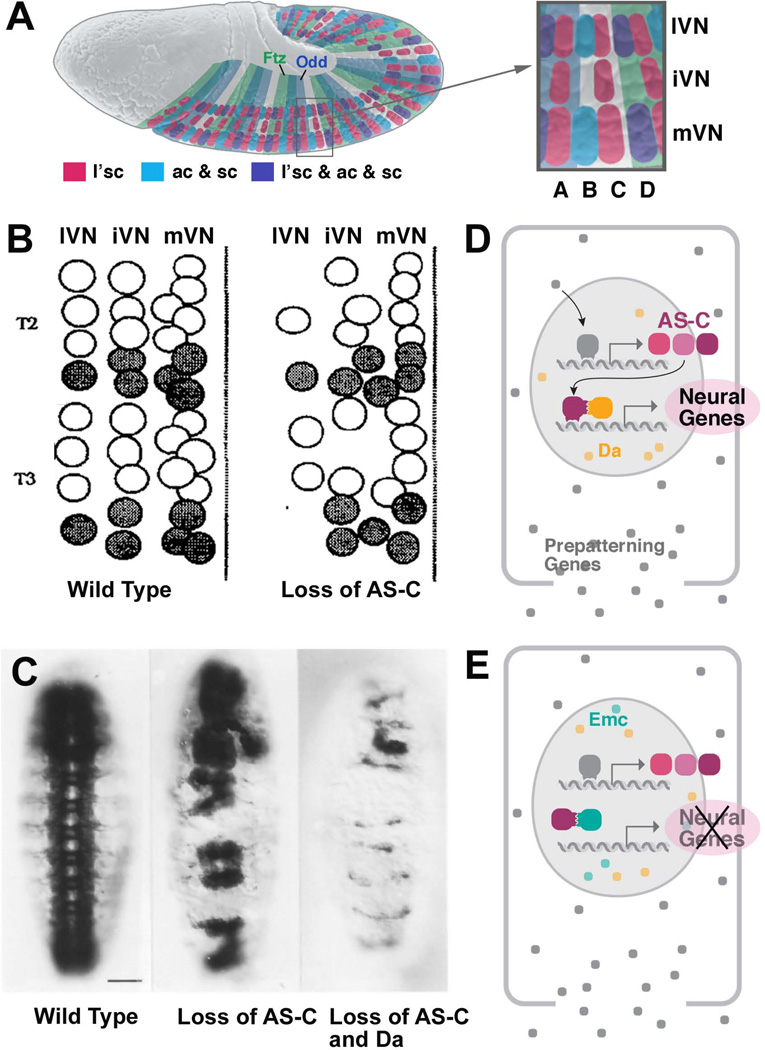
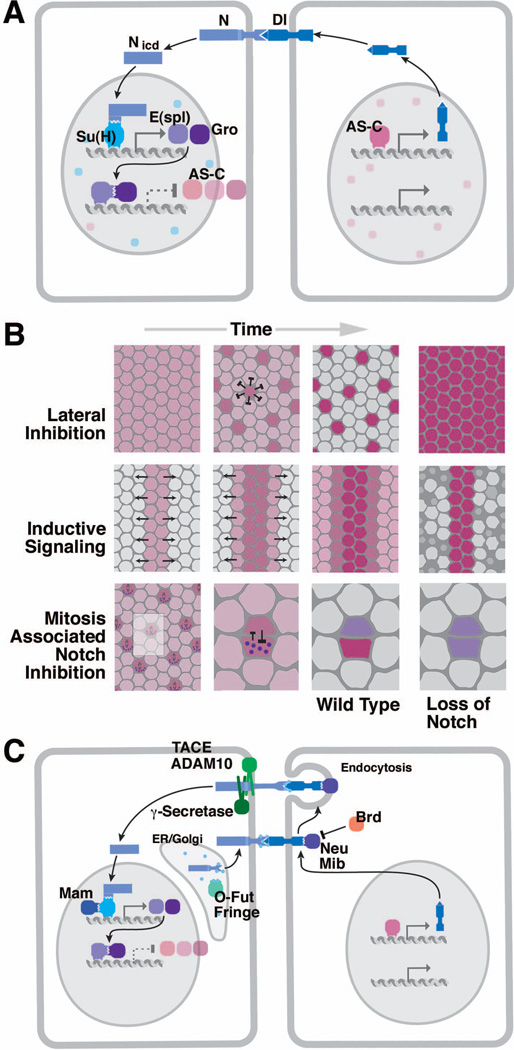
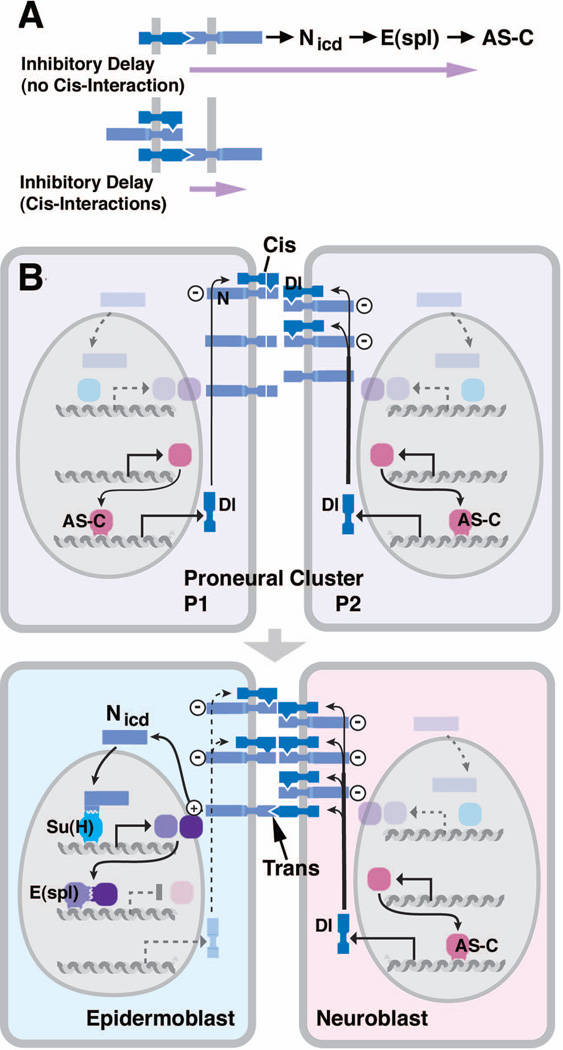
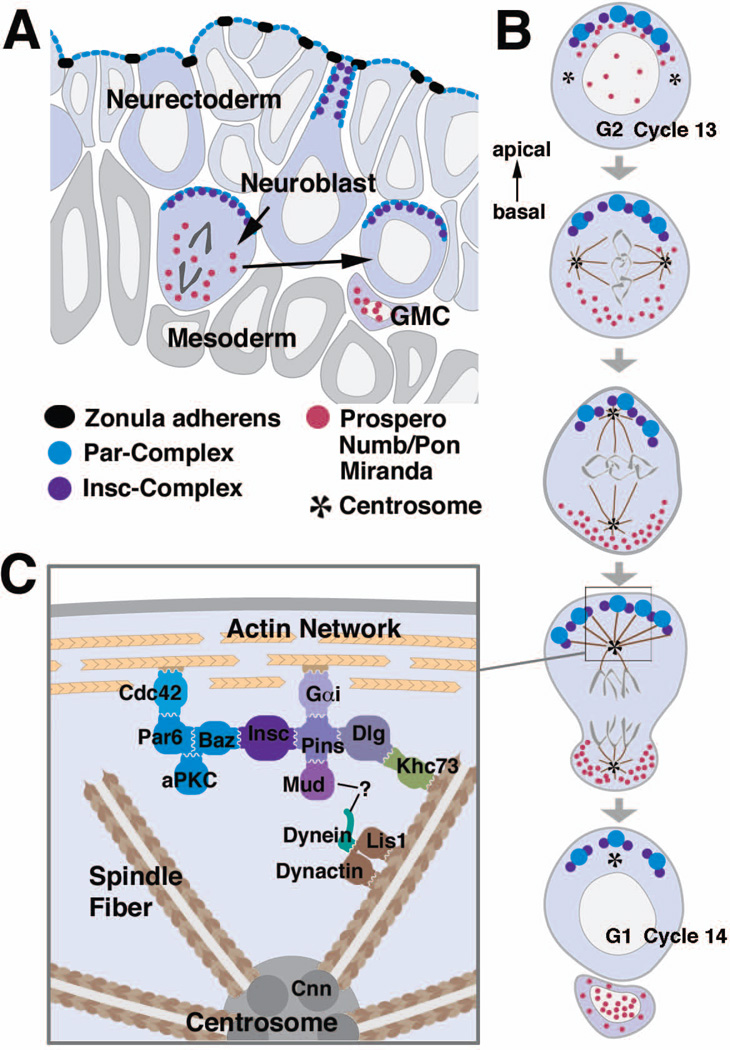
Early neurogenesis comprises the phase of nervous system development during which neural progenitor cells are born. In early development, the embryonic ectoderm is subdivided by a conserved signaling mechanism into two main domains, the epidermal ectoderm and the neurectoderm. Subsequently, cells of the neurectoderm are internalized and form a cell layer of proliferating neural progenitors. In vertebrates, the entire neurectoderm folds into the embryo to give rise to the neural tube. In Drosophila and many other invertebrates, a subset of neurectodermal cells, called neuroblasts (NBs), delaminates and forms the neural primordium inside the embryo where they divide in an asymmetric, stem cell-like mode. The remainder of the neurectodermal cells that stay behind at the surface loose their neurogenic potential and later give rise to the ventral part of the epidermis. The genetic and molecular analysis of the mechanisms controlling specification and proliferation of NBs in the Drosophila embryo, which played a significant part in pioneering the field of modern developmental neurobiology, represents the topic of this review.


Figures

Figure 1
Figure 1. Development and pattern of neuroblasts
(A) On the left is a schematic drawing of a cross section of the embryonic nervous system of the cricket. This is one of the first depictions of neural lineages, consisting of NBs and stacks of GMCs and neurons (from). In the center is a drawing by M. Bate, depicting the full set of NBs in one hemisegment of the grasshopper embryo. The drawing on the right (from) shows the NB pattern of several hemisegments of the Drosophila embryo, drawn to the same scale. Only S1/S2 NBs, forming four rows and three columns, have formed at the stage depicted. (B) Histological cross sections of the Drosophila embryo prior to (upper panel) and after (lower panel) NB delamination. Only left ventral quadrant of the embryo is shown. The ventral neurectoderm can be distinguished from the dorsal ectoderm by its tall cylindrical cells. Prior to NB delamination, a division in medial column, intermediate column, and lateral column (mVN, iVN, lVN) is evident. (C) Lateral view of Drosophila embryo prior to (upper panel) and after (lower panel) NB delamination. In this and all other figures, anterior is to the left, dorsal is up. Neurectoderm and dorsal ectoderm are shaded in purple, and blue, respectively; white lines and letters indicate segments. (D) NB map of one abdominal hemisegment (from). Left: S1 NBs; locations where S2 and S3 will appear are indicated by filled and open circles, respectively. Center: S1-S3 NBs; location where S4 and S5 NBs will appear indicated by filled and open circles, respectively. Right: All NBs have delaminated. Midline is represented by hatched line. NBs are individually identified by numbers and gene expression pattern (coloring).
Figure 2
Figure 2. The proneural-neurogenic gene network controls NB patterning
(A) Lateral view of Drosophila embryo prior to NB delamination. Expression of the prepatterning factors which trigger proneural gene expression is indicated by coloring. Along the antero-posterior axis, Vnd, Ind, and Msh are expressed in the medial, intermediate, and lateral column of the neurectoderm, respectively; segment polarity genes and pair rule genes (represented by Ftz and Odd) define transverse domains in each segment. (B) Photograph showing ventral view of medial neurectoderm (mVN: medial column); proneural clusters expressing ac are labeled brown; purple stripes indicate expression of segment polarity gene engrailed (from). (C) Schematic cross section of neurectoderm, indicating pattern of proneural clusters (purple shading). Rectangle indicates frame shown in panel (E). (D) Artistic rendering of proneural cluster before (top), during (middle), and after NB delamination (bottom; from). (E) Lateral inhibition within proneural cluster mediated by N, Dl and E(spl) genes. (F) Two-step model of NB specification. Expression of proneural genes defines proneural clusters (top); lateral inhibition in each cluster selects NB (bottom).
Figure 3
Figure 3. Development of a Drosophila mechanosensory bristle (sensillum)
(A) Schematic cross section of mature sensillum, showing cuticular apparatus (bristle shaft and socket) and underlying cells. (B) Schematic cross sections of developing sensillum. Sensillum progenitor (SOP; pI) divides into two daughters, pIIa and pIIb. pIIa divides into the support cells forming the sensillum shaft and socket (tr, to). pIIb gives rise to the neuron (ne), glial cell (gl), and inner sheath cell (th). (C) Drawing of the back of the Drosophila thorax (notum), showing pattern of mechanosensory bristles. Large bristles (machrochaetae) form an invariant pattern and are individually named (anp, anterior notopleural; apa, anterior postalar ; pdc, posterior dorsocentral; pnp, posterior notopleural; psc, posterior scutellar). (D) Larval imaginal wing disc giving rise to wing blade and notum. Proneural clusters are labeled by expression of proneural gene scute. Each one of the macrochaetae can be assigned to one proneural cluster.
Figure 4
Figure 4. Proneural genes promote neural development
(A) Lateral view of embryo prior to NB delamination. Expression pattern of the proneural genes ac, sc and l’sc in proneural clusters corresponding to S1 NBs. (B) Map of S1-S3 NBs of two hemisegments (T2, T3) in wild type embryo (left) and embryo deficient for the AS-C (right) (from). (C) Photographs of ventral nerve cord labeled with anti- HRP in wild type (left), loss of AS-C (center), loss of AS-C and da (right). (D, E) Role of proneural gene products of AS-C and interacting factors (Da and Emc).
Figure 5
Figure 5. The N pathway and signaling during early neurogenesis
(A) Core elements of the N pathway (AS-C, transcripts of AS-C; E(spl), transcripts of E(spl)-C; Nicd, cleaved intracellular domain of N). (B) Three types of Notch signaling (lateral inhibition, inductive signaling, mitosis-associated Notch inhibition). Rectangles represent neurectoderm; red shading indicates potential cell fate. In lateral inhibition, all cells start out with a neurogenic fate (left); Notch-mediated lateral inhibition restricts neural fate to NBs (center); loss of Notch results in neural hyperplasia (right). Inductive signaling presupposes a population of cells that are already committed to a specific fate (e.g., wing margin; photoreceptors; left panel). These cells send a N signal to their neighbors inducing in them the expression of other fate determinants (center). Loss of N results in the failure of induction, often accompanied by cell death (right). The signaling scenario at the bottom links N signaling to cell division: prior to mitosis, N pathway is active in all cells (e.g. NBs; SOPs; left); at the same time, the N inhibitor Numb (purple) is channeled into one daughter cell, which thereupon shuts off the N pathway and adopts a different fate (center); loss of N results in both cells retaining their original fate (right). (C) Modulators and signal transducers of the N pathway.
Figure 6
Figure 6. The role of cis-interactions between N and Dl
(A) Without cis-interactions the inhibitory delay (purple arrow) is long, including the time interval from N-Dl interaction to build-up of inhibitory E(spl); assuming cis-interaction, the delay is shortened to just N-Dl interaction and N cleavage. (B) Mechanism of cis-interaction between N and Dl. For detail, see text.
Figure 7
Figure 7. Asymmetric division of NBs
(A) Schematic cross section of the neurectoderm showing NBs before, during and after delamination. (B) Time course of the first mitosis of a NB after delamination. Note that spindle rotation (compare second and third panel from the top) does only occur in the first mitosis after delamination, but not in subsequent mitoses. (C) Interactions between the cortex and astral microtubules. For details see text. Color coding of protein complexes is the same for all three panels.

References

    1. Wheeler WM. Neuroblasts in the arthropod embryo. J Morph. 1891;4:337–343.
    1. Bate CM. Embryogenesis of an insect nervous system. I. A map of the thoracic and abdominal neuroblasts in Locusta migratoria. J Embryol Exp Morphol. 1976;35:107–123. - PubMed
    1. Hartenstein V, Campos-Ortega JA. Early neurogenesis in wildtype Drosophila melanogaster. Roux’s Arch Dev Biol. 1984;193:308–325. - PubMed
    1. Doe CQ. Molecular markers for identified neuroblasts and ganglion mother cells in the Drosophila central nervous system. Development. 1992;116:855–863. - PubMed
    1. Urbach R, Technau GM. Molecular markers for identified neuroblasts in the developing brain of Drosophila. Development. 2003;130:3621–3637. - PubMed

Publication types

LinkOut - more resources