. 2013 Sep;25(9):3186-211.
doi: 10.1105/tpc.113.115741. Epub 2013 Sep 6.

Copper response regulator1-dependent and -independent responses of the Chlamydomonas reinhardtii transcriptome to dark anoxia

Affiliations

Copper response regulator1-dependent and -independent responses of the Chlamydomonas reinhardtii transcriptome to dark anoxia

Anja Hemschemeier et al. Plant Cell. 2013 Sep.

Abstract

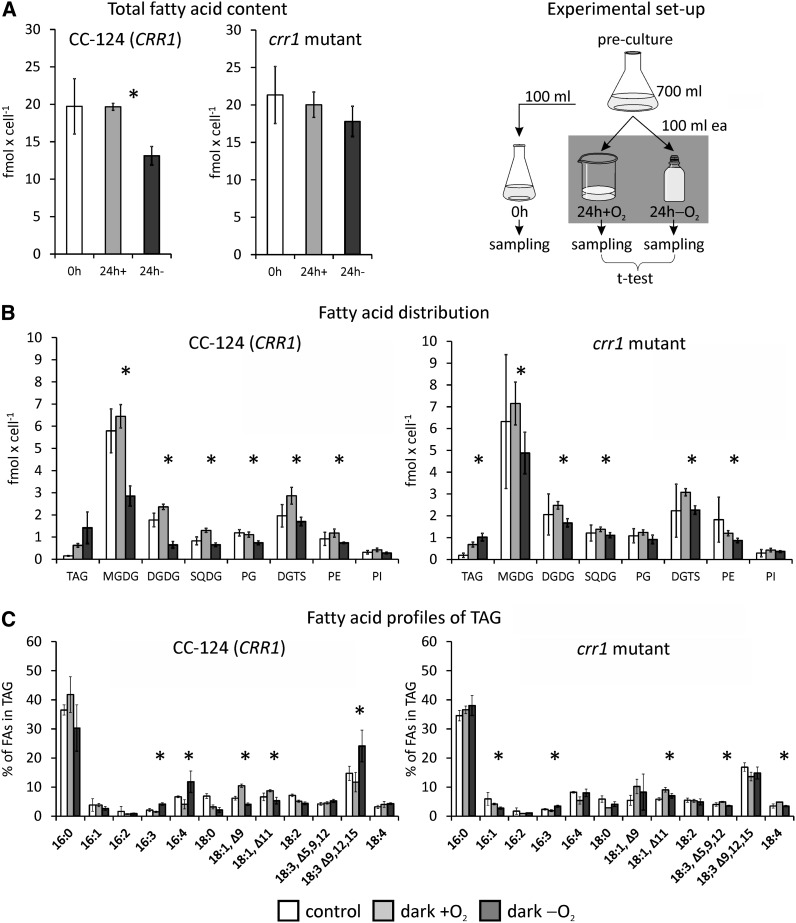
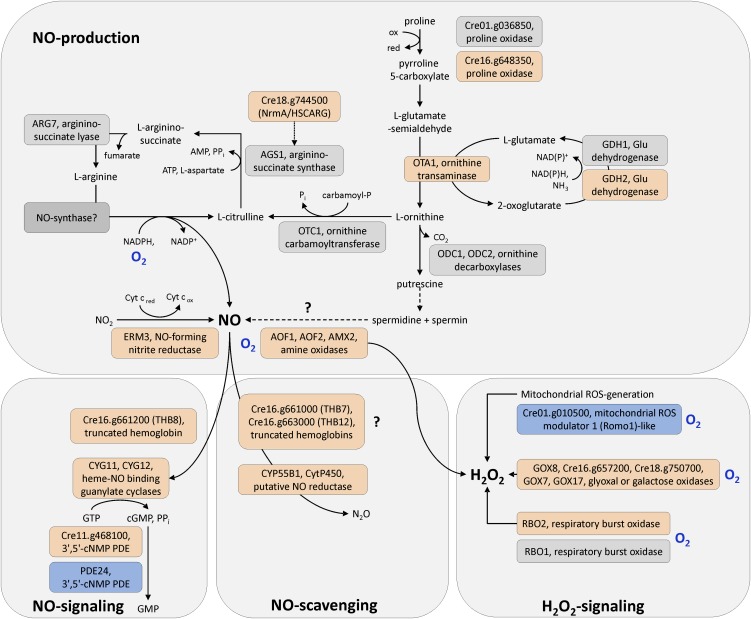
Anaerobiosis is a stress condition for aerobic organisms and requires extensive acclimation responses. We used RNA-Seq for a whole-genome view of the acclimation of Chlamydomonas reinhardtii to anoxic conditions imposed simultaneously with transfer to the dark. Nearly 1.4 × 10(3) genes were affected by hypoxia. Comparing transcript profiles from early (hypoxic) with those from late (anoxic) time points indicated that cells activate oxidative energy generation pathways before employing fermentation. Probable substrates include amino acids and fatty acids (FAs). Lipid profiling of the C. reinhardtii cells revealed that they degraded FAs but also accumulated triacylglycerols (TAGs). In contrast with N-deprived cells, the TAGs in hypoxic cells were enriched in desaturated FAs, suggesting a distinct pathway for TAG accumulation. To distinguish transcriptional responses dependent on copper response regulator1 (CRR1), which is also involved in hypoxic gene regulation, we compared the transcriptomes of crr1 mutants and complemented strains. In crr1 mutants, ~40 genes were aberrantly regulated, reaffirming the importance of CRR1 for the hypoxic response, but indicating also the contribution of additional signaling strategies to account for the remaining differentially regulated transcripts. Based on transcript patterns and previous results, we conclude that nitric oxide-dependent signaling cascades operate in anoxic C. reinhardtii cells.


Figures

Figure 1.
Figure 1.
Experimental Setup and Sample Evaluation by RNA Gel Blot Hybridization. (A) Schematic of the experimental proceeding applied for establishing anoxic conditions in algal cultures. Time points of RNA sampling are indicated. (B) HYDA1 RNA hybridization in samples isolated according to the scheme shown in (A). Shown are results from two independent experiments (i and ii) of all C. reinhardtii clones analyzed in this study. Wild-type strain CC-124 is indicated as CRR1. Transcript levels of RCK1 (CBLP, Cre13.g599400) served as loading control. Asterisks in the right panel (ii) mark the RNA samples that were sequenced.
Figure 2.
Figure 2.
Functional Annotation of Differentially Accumulating Transcripts in Dark-Anoxic Wild-Type C. reinhardtii. Transcripts whose abundance changed at least fourfold (FDR ≤ 5%) in cells incubated for 0.5 or 6 h under dark-anoxic conditions were selected. Numbers show the total amount of transcripts down- or upregulated at each time point. Deduced proteins were grouped according to functional categories (described in Supplemental Methods 1 online). T1 to T13 indicate the sheet number in Supplemental Data Set 1 online in which individual transcripts are listed. ROS, reactive oxygen species; RNS, reactive nitrogen species.
Figure 3.
Figure 3.
A Subset of CRR1-Responsive Genes Is Regulated by Both Cu Nutrition and Hypoxia. CRR1 targets were determined in the subset of transcripts whose fold changes in the 6-h versus 0-h comparison had an FDR < 0.05 in the rescued strain crr1:CRR1. A transcript was defined as CRR1 target when its fold change after 6-h anoxia was at least fourfold different from the fold changes in the rescued strain. (A) Total number of anoxic CRR1 targets. (B) Anoxic CRR1 targets differentiated between transcripts whose fold changes after 6-h anoxia were lower in the mutants compared with the rescued strain (lower) and those whose fold changes were higher (higher). (C) Intersection of CRR1 targets defined in anoxia and in Cu deficiency. Anoxic CRR1 targets identified in crr1 mutants were compared with the CRR1 targets identified in Cu deficiency by Castruita et al. (2011).
Figure 4.
Figure 4.
An Anaerobic Atmosphere Impacts the Growth of the C. reinhardtii crr1 Mutant. The indicated strains (wild-type CC-124 is labeled by CRR1) were grown to the midexponential growth phase under standard conditions. Then they were diluted to chlorophyll concentrations of 2, 1, and 0.5 µg mL−1 and spotted on two TAP agar plates. Each one of the plates was incubated aerobically (+O2) or anaerobically (−O2) in the light (50 µmol photons m−2 s−1). Photographs were taken after 5 (+O2 and −O2 I) and 8 d of growth (−O2 II).
Figure 5.
Figure 5.
Impact of Light and Oxygen on Photosynthetic Parameters of the C. reinhardtii Wild Type. (A) Maximum PSII quantum efficiency determined in culture aliquots incubated in the measuring cuvette in the dark for 15 min. (B) O2 evolution rates determined from the same cultures analyzed in (A) prior to the chlorophyll fluorescence measurements. Cultures had a cell density of 3 × 10⁶ cells mL−1 at 0 h. Values of three independent experiments are shown. Error bars = sd.
Figure 6.
Figure 6.
Regulation of Genes Involved in Energy-Generating Pathways. The figure summarizes pathways employed for energy generation and indicates proteins whose transcript amounts increased (red), decreased (blue), or stayed unchanged (light gray) in anoxic C. reinhardtii CC-124 (CRR1) cells. O2-dependent enzymes are marked by a blue O2 label. The accumulation of various transcripts involved in amino acid catabolism indicated that, in parallel to starch, the cells used amino acids as a substrate for heterotrophic ATP synthesis, possibly via gluconeogenesis and the glyoxylate cycle.
Figure 7.
Figure 7.
Profiles of FAs and Lipids. The total content of FAs (A), the amounts of FAs associated with TAG or membrane lipids (B), and profile of FA species associated with TAG (C) were analyzed in C. reinhardtii wild-type CC-124 (CRR1) and crr1 mutant cells grown aerated in the light (white bars) and then transferred to open beakers (light gray bars, dark +O2) or sealed flasks (dark gray bars, dark −O2) in the dark for 24 h. Values shown are the averages of biological triplicates. Error bars indicate sd. Asterisks indicate that the difference between samples incubated anaerobically versus aerobically in the dark was significant (P value < 0.05). SQDG, sulfoquinovosyldiacylglycerol; PG, phosphatidylglycerol; DGTS, diacylglyceryl-N,N,N-trimethylhomoserine; PE, phosphatidylethanolamine; PI, phosphatidylinositol.
Figure 8.
Figure 8.
ROS/NO Production, Signaling, and Detoxification Pathways. Upregulated transcripts and the encoded proteins, respectively, are shown in red, and downregulated transcripts (proteins) are colored in blue. Not significantly regulated transcripts (enzymes) are indicated by gray boxes. Blue O2 labels mark O2-dependent steps. Question marks indicate uncertain pathways.
Figure 9.
Figure 9.
Impact of O2 on HYDA1 Transcript in the Dark. (A) Cells were incubated for the indicated time points in open (+O2, light-gray bar) or sealed (−O2, dark-gray bar) flasks in the dark. Cell concentrations at 0 h (white bar) were 2.2 × 10⁶ cells mL−1. (B) and (C) Light-grown cells (0 h, white bar) were incubated for 2.5 h in sealed flasks in the dark (dark-gray bar) and then transferred to open beakers in the dark (+O2, light-gray arrow) or kept in sealed flasks (−O2, dark-gray arrow) for the indicated time points. Cell numbers of the precultures were 2.7 (B) and 2.2 × 10⁶ cells mL−1 (C). RNA was isolated at the depicted time points. HYDA1 RNA hybridization was conducted with a HYDA1-specific probe. RCK1 (CBLP, Cre13.g599400) served as the reference transcript. Supplemental Figures 6A and 6B online provide schemes of the experimental setups.
Figure 10.
Figure 10.
Effect of O2 on Transcript Abundances Estimated by qRT-PCR. (A) Cells were incubated aerobically (+; light-gray bars) or anaerobically (–; dark-gray bars) in the dark (see Supplemental Figure 6A online). (B) Cell suspensions were first incubated for 2.5 h in sealed flasks in the dark (2.5-; dark-gray bar) and then transferred to open beakers in the dark (+; light gray arrows) or kept in sealed flasks (–; dark gray arrows) (see Supplemental Figure 6B online). In all cases, RNA was isolated also from precultures grown aerated in the light (0; white bars). Relative transcript abundances were calculated relative to the RCK1 transcript (CBLP, Cre13.g599400). Values shown are from biological triplicates, analyzed in technical triplicates. Error bars = sd.
Figure 11.
Figure 11.
Preincubation with DCMU Affects Dark-Induced Transcript Accumulation. C. reinhardtii wild-type CC-124 was grown under standard conditions in the light until a cell density of 3 × 10⁶ cells mL−1. Then, the culture was split in two and 2.5 µM of the specific photosystem II inhibitor DCMU was added to one aliquot, while an equivalent volume of ethanol was added to the other. After further incubation in the light for 1 h, each cell suspension was transferred to either open beakers (+) or sealed flasks (–) in the dark for 0.5 h. RNA was isolated before the preculture was split (indicated by −1h), after 1-h incubation in the light with (dark-gray bars) or without (light-gray bars) DCMU (0h) and after 0.5 h of incubation in the dark (0.5h+ and 0.5h−). Transcript abundances were calculated relative to the RCK1 transcript (CBLP, Cre13.g599400). Values shown are averages of biological replicates. Error bars = sd. See Supplemental Figure 6C online for a scheme of the experimental setup.

Similar articles

Cited by

References

    1. Adams S., Maple J., Møller S.G. (2008). Functional conservation of the MIN plastid division homologues of Chlamydomonas reinhardtii. Planta 227: 1199–1211 - PubMed
    1. Allen M.D., Kropat J., Merchant S.S. (2008). Regulation and localization of isoforms of the aerobic oxidative cyclase in Chlamydomonas reinhardtii. Photochem. Photobiol. 84: 1336–1342 - PubMed
    1. Almeida C.C., Romão C.V., Lindley P.F., Teixeira M., Saraiva L.M. (2006). The role of the hybrid cluster protein in oxidative stress defense. J. Biol. Chem. 281: 32445–32450 - PubMed
    1. Anbar A.D. (2008). Oceans. Elements and evolution. Science 322: 1481–1483 - PubMed
    1. Anders S., Huber W. (2010). Differential expression analysis for sequence count data. Genome Biol. 11: R106. - PMC - PubMed

Publication types

MeSH terms