. 2013 Oct;163(2):973-85.
doi: 10.1104/pp.113.226761. Epub 2013 Sep 6.

Alterations in seed development gene expression affect size and oil content of Arabidopsis seeds

Affiliations

Alterations in seed development gene expression affect size and oil content of Arabidopsis seeds

Abdelhak Fatihi et al. Plant Physiol. 2013 Oct.

Abstract

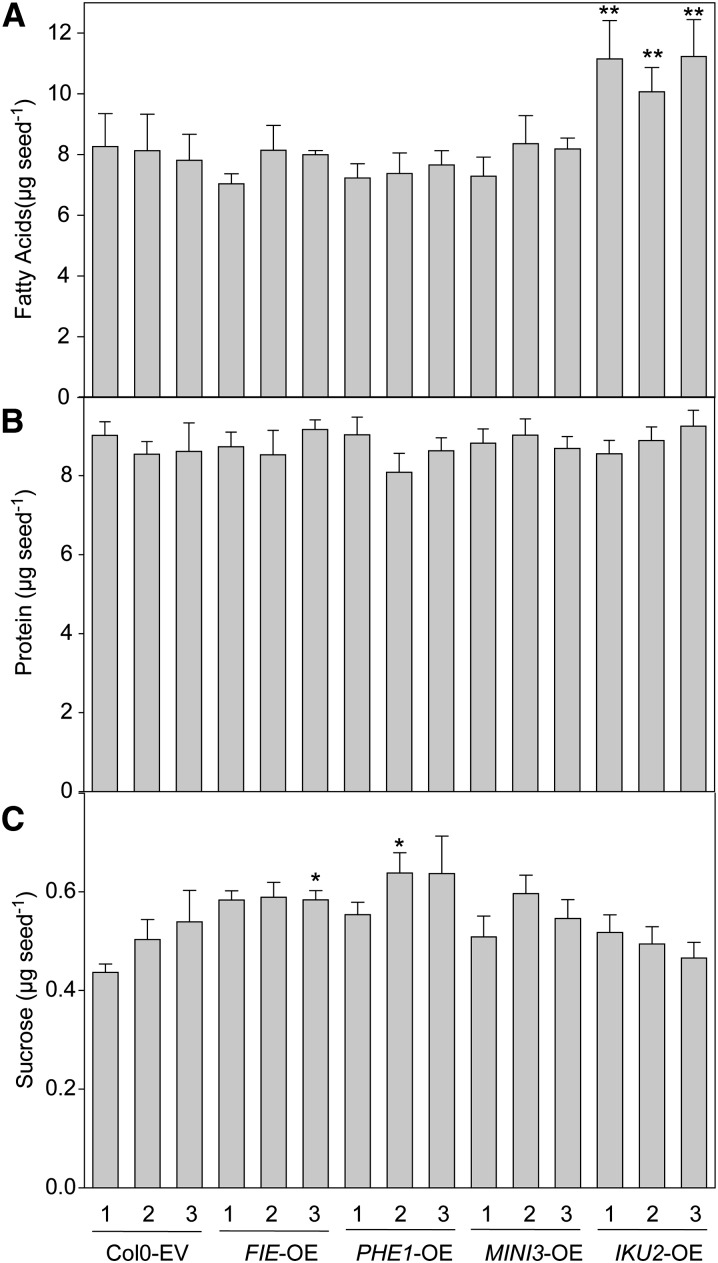
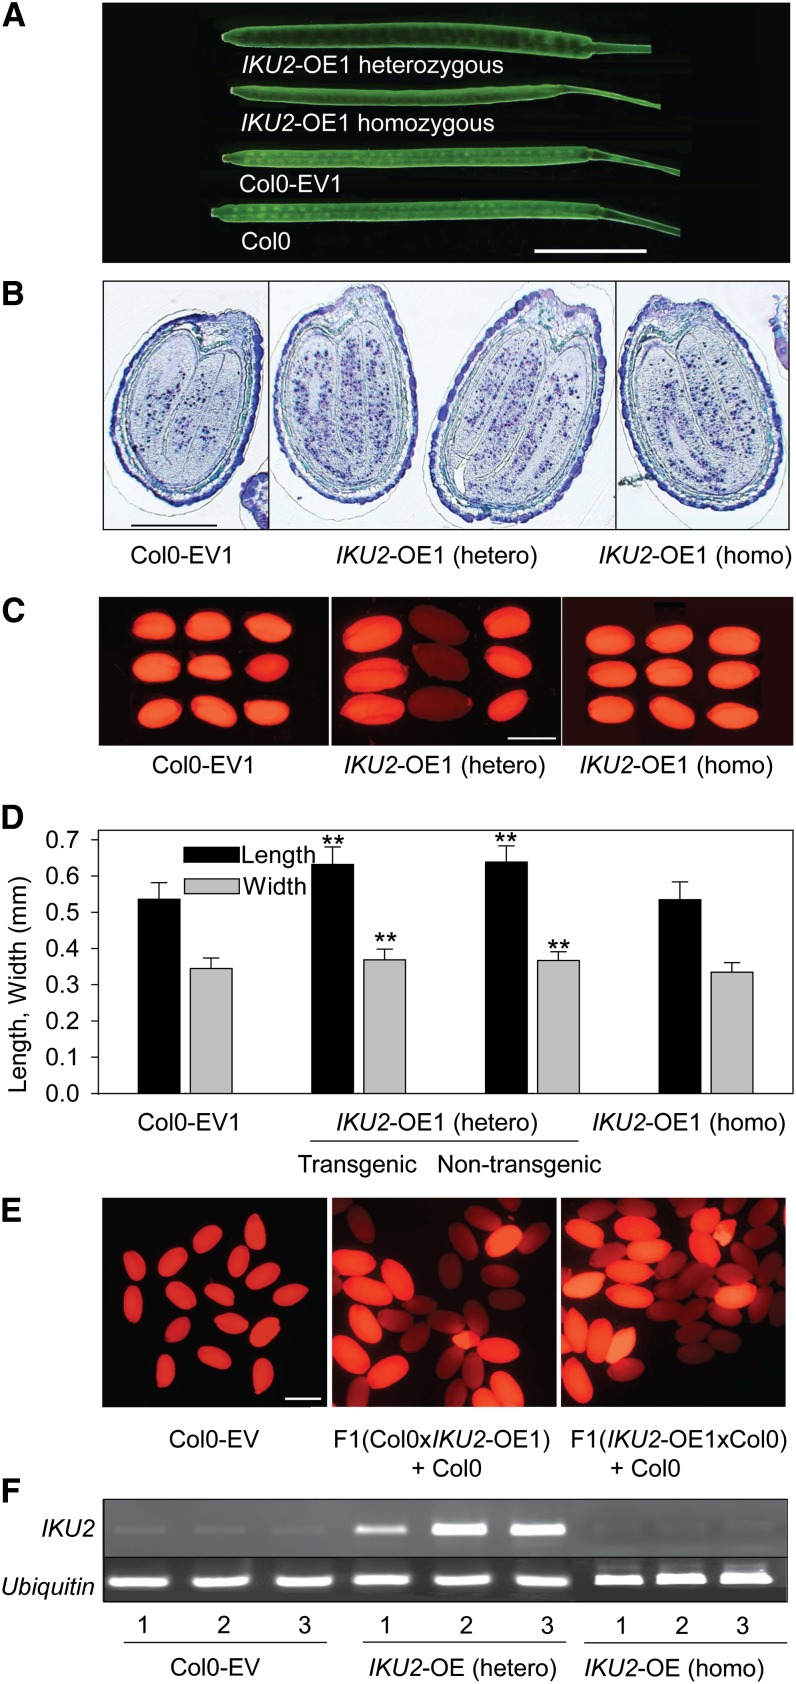
Seed endosperm development in Arabidopsis (Arabidopsis thaliana) is under control of the polycomb group complex, which includes Fertilization Independent Endosperm (FIE). The polycomb group complex regulates downstream factors, e.g. Pheres1 (PHE1), by genomic imprinting. In heterozygous fie mutants, an endosperm develops in ovules carrying a maternal fie allele without fertilization, finally leading to abortion. Another endosperm development pathway depends on MINISEED3 (a WRKY10 transcription factor) and HAIKU2 (a leucine-rich repeat kinase). While the role of seed development genes in the embryo and endosperm establishment has been studied in detail, their impact on metabolism and oil accumulation remained unclear. Analysis of oil, protein, and sucrose accumulation in mutants and overexpression plants of the four seed development genes revealed that (1) seeds carrying a maternal fie allele accumulate low oil with an altered composition of triacylglycerol molecular species; (2) homozygous mutant seeds of phe1, mini3, and iku2, which are smaller, accumulate less oil and slightly less protein, and starch, which accumulates early during seed development, remains elevated in mutant seeds; (3) embryo-specific overexpression of FIE, PHE1, and MINI3 has no influence on seed size and weight, nor on oil, protein, or sucrose content; and (4) overexpression of IKU2 results in seeds with increased size and weight, and oil content of overexpressed IKU2 seeds is increased by 35%. Thus, IKU2 overexpression represents a novel strategy for the genetic manipulation of the oil content in seeds.


Figures

Figure 1.
Figure 1.
Insertional mutants of the seed development genes FIE, PHE1, MINI3, and IKU2. A, Exon intron structure and location of mutations. Exons and introns are depicted by boxes and lines, respectively. The locations of the T-DNA or transposon insertions are indicated by triangles. The mutants are derived from different ecotype backgrounds (Supplemental Table S1). B, Expression analysis of seed development genes in the phe1, mini3, and iku2 mutants. The RT-PCR products obtained with RNA isolated from developing siliques (5 DAF) of homozygous mutant plants (phe1, mini3, and iku2) were separated in agarose gels and stained with ethidium bromide. Ubiquitin-specific primers were used as control. C, The seed size (length, black bars; width, gray bars) was determined after scanning the seeds using the Evaluator software. Data represent mean and sd of a minimum of 100 seeds. D, Seed weight obtained by measuring 100 seeds (n = 3, mean and sd). Mutants are organized according to their respective ecotype. Student’s t test, *P < 0.05, **P < 0.01.
Figure 2.
Figure 2.
Oil, protein, and Suc content in mutants of Arabidopsis seed development genes. A, Total fatty acids were measured in seeds of the phe1, mini3, and iku2 mutants after transmethylation by GC. B, Total protein content of seeds was determined photometrically. C, Suc in seeds was measured enzymatically. Data show mean and sd of at least three measurements of five seeds (fatty acids), 20 seeds (protein), and 50 seeds (Suc) each. Mutants of phe1, mini3, and iku2 are organized according to their respective ecotype. Student’s t test, *P < 0.05, **P < 0.01.
Figure 3.
Figure 3.
Accumulation of fatty acids, protein, starch, Suc, and Glc in phe1, mini3, and iku2 mutants during seed development. Flowers were tagged at anthesis, and seeds were collected after 7, 11, 15, and 19 DAF. The isolated seeds were employed for the determination of total fatty acids (A), protein (B), starch (C), Suc (D), and Glc (E). Data represent mean ± sd of five measurements. Similar results were obtained in an independent biological experiment.
Figure 4.
Figure 4.
Lipid composition of the fie mutant. Lipids were measured in aborted seeds derived from mutant ovules of heterozygous fie mutant plants after selfing. A, Total fatty acids were determined by transmethylation and GC. B, Fatty acid composition measured by GC of fatty acid methyl esters. C, TAG molecular species were quantified by Q-TOF mass spectrometry. Data represent mean and sd of three (GC) or five (Q-TOF) measurements of five seeds (the Col-0 and C24 wild type) or 25 seeds (fie-11 seeds). Student’s t test, *P < 0.05, **P < 0.01.
Figure 5.
Figure 5.
Overexpression of seed development genes in Arabidopsis. The cDNAs of the genes FIE, PHE1, MINI3, and IKU2 were cloned behind the seed-specific glycinin promoter and transferred into transgenic Arabidopsis plants. A, Expression of FIE, PHE1, MINI3, and IKU2 in overexpression lines of Arabidopsis. Developing siliques were harvested (approximately 13 DAF) from three independent plants each and used to isolate RNA for RT-PCR. Col-0 plants transformed with an empty vector (Col-0-EV) were used as control. The four lanes (1–4) of Col-0-EV represent RT-PCR reactions using primers for FIE, PHE1, MINI3, and IKU2, respectively. The RT-PCR products were separated in agarose gels and stained with ethidium bromide. Ubiquitin-specific primers were used as a reference. Note that expression of the four genes in the control lanes (Col-0-EV) is much lower compared with Figure 1 because the RNA was isolated from older siliques. B, Size of T2 seeds harvested from transgenic plants overexpressing FIE, PHE1, MINI3, or IKU2. Transgenic T2 seeds were selected based on their red fluorescence (DsRed marker). The photo shows transgenic seeds (top) and wild-type segregants (bottom) of the same plant. Bar = 0.5 mm. C, The size (length and width) of transgenic T2 seeds. Data show mean and sd of approximately 100 seeds. D, The weight of transgenic T2 seeds was determined by weighing three times 100 seeds each. Data show mean and sd. Student’s t test, *P < 0.05, **P < 0.01. [See online article for color version of this figure.]
Figure 6.
Figure 6.
Content of oil, protein, and sugars in seeds of transgenic overexpression plants. T2 seeds from heterozygous plants overexpressing FIE, PHE1, MINI3, or IKU2 were selected based on their red fluorescence. A, Total fatty acid content was measured by GC after transmethylation. B, Protein content was measured photometrically. C, The content of Suc was determined enzymatically. Data show mean and sd of at least three measurements of five seeds (fatty acids), 20 seeds (protein), and 50 seeds (Suc) each. Student’s t test, *P < 0.05, **P < 0.01.
Figure 7.
Figure 7.
Accumulation of fatty acids, protein, starch, Suc, and Glc in IKU2-OE lines during seed development. Developing seeds of heterozygous transgenic IKU2-OE1 and IKU2-OE2 plants were harvested at 7, 11, 15, and 19 DAF and employed for the measurements of total fatty acids (A), protein (B), starch (C), Suc (D), and Glc (E). Data are mean ± sd of five measurements. Similar results were obtained in a second independent experiment.
Figure 8.
Figure 8.
Seed yield of plants overexpression IKU2 (IKU2-OE). Siliques and seeds of Col-0-EV and of three independent heterozygous IKU2-OE plants were analyzed. A, Silique length (n = 10, mean and sd). B, Numbers of seeds per silique (n = 10, mean and sd). C, Total weight of seeds per plant (mean and sd, n = 7–10). Student’s t test, *P < 0.05, **P < 0.01.
Figure 9.
Figure 9.
Variation in sizes of seeds from homozygous and heterozygous IKU2-OE plants. A, Siliques from a heterozygous IKU2-OE1 plant are thicker than those from a homozygous IKU2-OE1 plant or from the controls (Col-0, Col-0-EV1). Bar = 5 mm. B, Light microscopy of immature seeds of the late cotyledon stage (14 DAF) after thin sectioning and toluidine blue staining. Representative seeds from siliques from Col-0-EV and a heterozygous (two adjacent seeds) and homozygous IKU2-OE1 plant are shown. Note that siliques of a heterozygous IKU2-OE plant contain large (heterozygous, nontransgenic segregants) or small seeds (homozygous). Bar = 200 µm. C, Mature seeds from a Col-0-EV and heterozygous and homozygous IKU2-OE plant. The photo shows red fluorescence of the DsRed marker. Seeds of a homozygous IKU2-O1 plant are small, similar to Col-0-EV1. Seeds of the heterozygous IKU2-OE1 plant segregate into three classes, large fluorescent seeds (heterozygous, left), small fluorescent seeds (homozygous, right), and large nonfluorescent seeds (nontransgenic segregants, center). Bar = 500 µm. D, Size measurement of transgenic seeds from a heterozygous Col-0-EV1 plant, fluorescent/transgenic (homozygous/heterozygous) seeds of a heterozygous IKU2-OE1 plant, wild-type segregant seeds of a heterozygous IKU2-OE plant, and seeds of a homozygous IKU2-OE1 plant. The length of the transgenic and wild-type segregant seeds of a heterozygous IKU2-OE plant is larger than that of Col-0-EV or homozygous IKU2-OE seeds. E, F1 seeds from reciprocal crosses of wild-type Col-0 with a homozygous IKU2-OE1 plant. The photo shows fluorescent seeds of Col-0-EV and F1 seeds obtained after reciprocal crosses (Col-0 × IKU2-OE1, IKU2-OE1 × Col-0). Nontransgenic, nonfluorescent Col-0 seeds were mixed to the F1 seeds as an internal size control. F, Expression analysis of IKU2 in seeds of heterozygous and homozygous IKU2-OE lines. Total RNA was isolated from immature siliques (approximately 13 DAF). The RT-PCR products were separated in agarose gels and stained with ethium bromide. Expression in seeds of a homozygous plant is severely repressed compared with seeds from the heterozygous plant and is even lower than in seeds of a Col-0-EV1 plant. Student’s t test, *P < 0.05, **P < 0.01. [See online article for color version of this figure.]

Similar articles

Cited by

References

    1. Baroux C, Pien S, Grossniklaus U. (2007) Chromatin modification and remodeling during early seed development. Curr Opin Genet Dev 17: 473–479 - PubMed
    1. Baud S, Boutin JP, Miquel M, Lepiniec L, Rochat C. (2002) An integrated overview of seed development in Arabidopsis thaliana ecotype WS. Plant Physiol Biochem 40: 151–160
    1. Baud S, Wuillème S, Lemoine R, Kronenberger J, Caboche M, Lepiniec L, Rochat C. (2005) The AtSUC5 sucrose transporter specifically expressed in the endosperm is involved in early seed development in Arabidopsis. Plant J 43: 824–836 - PubMed
    1. Browse J, McCourt PJ, Somerville CR. (1986) Fatty acid composition of leaf lipids determined after combined digestion and fatty acid methyl ester formation from fresh tissue. Anal Biochem 152: 141–145 - PubMed
    1. Clough SJ, Bent AF. (1998) Floral dip: a simplified method for Agrobacterium-mediated transformation of Arabidopsis thaliana. Plant J 16: 735–743 - PubMed

Publication types

LinkOut - more resources