. 2013 Nov 15;305(10):H1451-61.
doi: 10.1152/ajpheart.00238.2013. Epub 2013 Sep 6.

COX-1-derived PGE2 and PGE2 type 1 receptors are vital for angiotensin II-induced formation of reactive oxygen species and Ca(2+) influx in the subfornical organ

Affiliations

COX-1-derived PGE2 and PGE2 type 1 receptors are vital for angiotensin II-induced formation of reactive oxygen species and Ca(2+) influx in the subfornical organ

Gang Wang et al. Am J Physiol Heart Circ Physiol. .

Abstract

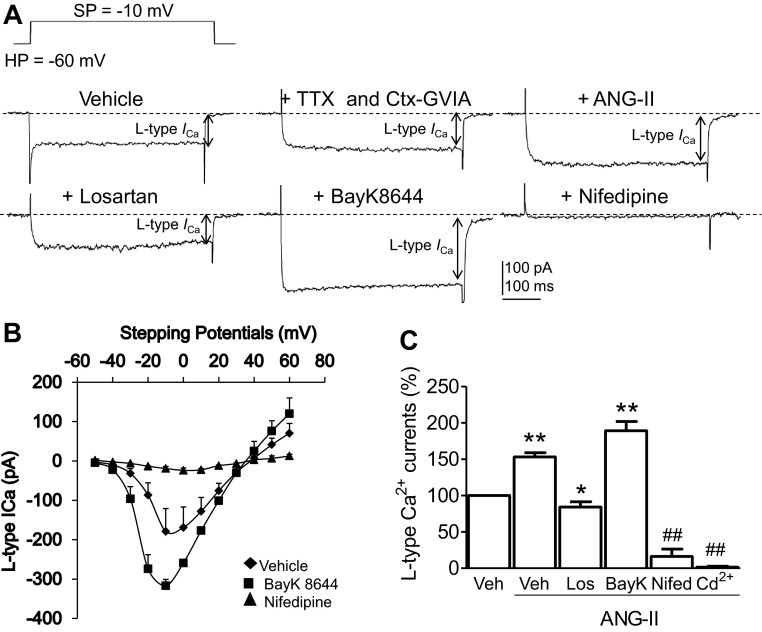
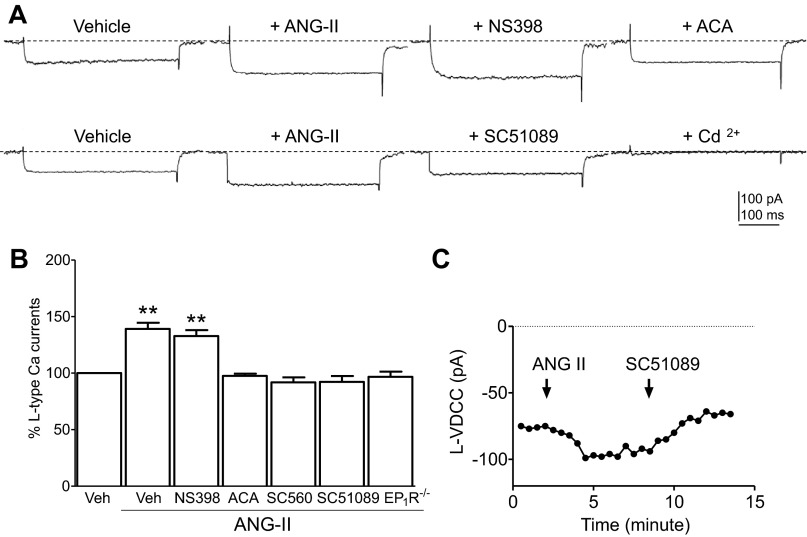
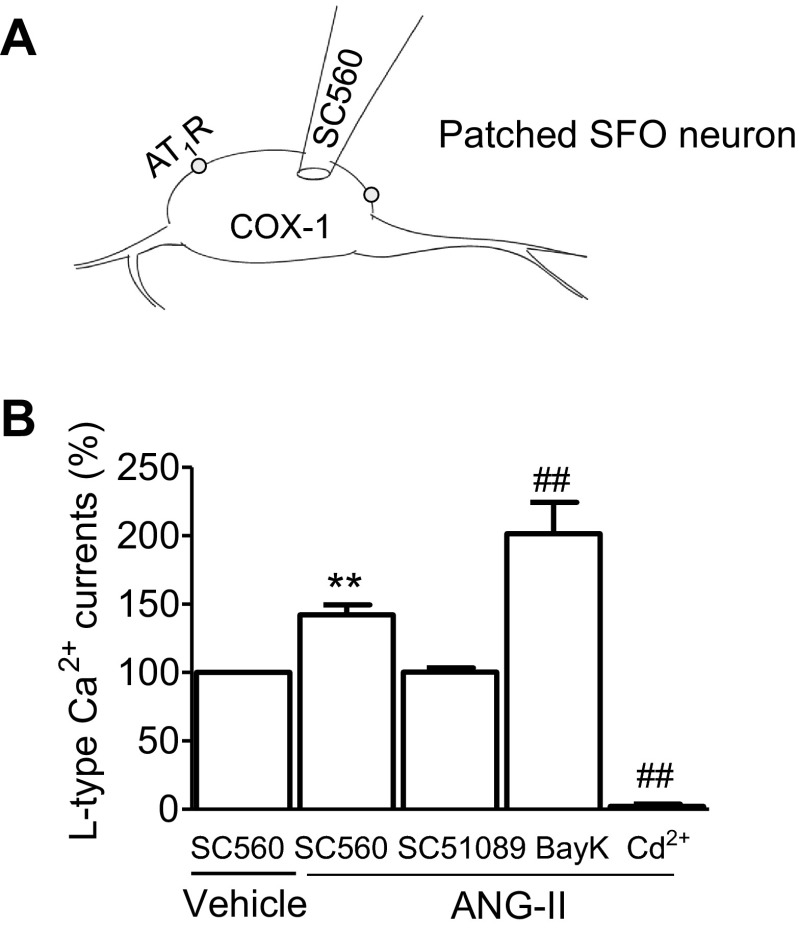
Regulation of blood pressure by angiotensin II (ANG II) is a process that involves the reactive oxygen species (ROS) and calcium. We have shown that ANG-II type 1 receptor (AT1R) and prostaglandin E2 (PGE2) type 1 receptors (EP1R) are required in the subfornical organ (SFO) for ROS-mediated hypertension induced by slow-pressor ANG-II infusion. However, the signaling pathway associated with this process remains unclear. We sought to determine mechanisms underlying the ANG II-induced ROS and calcium influx in mouse SFO cells. Ultrastructural studies showed that cyclooxygenase 1 (COX-1) codistributes with AT1R in the SFO, indicating spatial proximity. Functional studies using SFO cells revealed that ANG II potentiated PGE2 release, an effect dependent on AT1R, phospholipase A2 (PLA2) and COX-1. Furthermore, both ANG II and PGE2 increased ROS formation. While the increase in ROS initiated by ANG II, but not PGE2, required the activation of the AT1R/PLA2/COX-1 pathway, both ANG II and PGE2 were dependent on EP1R and Nox2 as downstream effectors. Finally, ANG II potentiated voltage-gated L-type Ca(2+) currents in SFO neurons via the same signaling pathway required for PGE2 production. Blockade of EP1R and Nox2-derived ROS inhibited ANG II and PGE2-mediated Ca(2+) currents. We propose a mechanism whereby ANG II increases COX-1-derived PGE2 through the AT1R/PLA2 pathway, which promotes ROS production by EP1R/Nox2 signaling in the SFO. ANG II-induced ROS are coupled with Ca(2+) influx in SFO neurons, which may influence SFO-mediated sympathoexcitation. Our findings provide the first evidence of a spatial and functional framework that underlies ANG-II signaling in the SFO and reveal novel targets for antihypertensive therapies.

Keywords: angiotensin II; calcium channel; hypertension; prostaglandins; reactive oxygen species; slow-pressor; subfornical organ.


Figures

Fig. 1.
Fig. 1.
Cyclooxygenase-1 (COX-1) immunolabeling within the central subfornical organ (SFO) is highly concentrated within neuronal postsynaptic processes, most of which also display angiotensin-II (ANG II) type 1 receptor (AT1R)-enhanced green fluorescent protein (eGFP) immunoperoxidase (ImP) labeling, and glial processes. A: AT1R-eGFP-ImP-positive cell body (Soma) and dendrite (LDen), both near fenestrated capillaries (Fen Cap), contain COX-1-immunogold (ImG) particles (arrows). B: COX-1 ImG labeling (arrows) of a glial process (Glia) and an AT1R-GFP-ImP-labeled dendrite (LDen). C: COX-1 ImP labeling (arrow) near a mitochondrion in an unlabeled dendritic process (Den). D: histogram of the percent distribution of all COX-1 ImG labeling by process type (Vasc glia, glial associated with fenestrated capillaries; Vasc epith, vascular epithelial cells), divided by whether the process did (dark grey) or did not (light grey) colabel for AT1R-GFP. Scale bars = 0.5 μm.
Fig. 2.
Fig. 2.
A: one example of calcein-labeled isolated SFO cells 1 h after loading calcein AM (1 μmol/l). The white arrows indicate SFO neurons, whereas black arrows indicate red blood cells. Bar = 10 μm. B: time course of a group of calcein-labeled SFO cells is shown (P > 0.05 vs. 0 min, number of experiments = 3; cell number in each experiment = 48–54). C: histogram shows amounts of endogenous prostaglandin E2 (PGE2) released from the wild-type (WT) SFO cells in the presence of vehicle (Veh, N = 9), ANG II (100 nmol/l, N = 5), coapplied AT1R antagonist losartan (Los, 3 μmol/l, N = 9) and the phospholipase A2 (PLA2) inhibitor N-(p-amylcinnamoyl)anthranilic acid (ACA; 1 μmol/l, N = 8) or endogenous PGE2 released from COX-1−/− (N = 6) and COX-2−/− (N = 5) SFO cells in the presence of ANG II (100 nmol/l), respectively. D: histogram summarizes amounts of endogenous PGE2 released from WT paraventricular nucleus cells in the presence of Veh (V; N = 4) and ANG II (100 nmol/l, N = 4). Each tissue sample was collected from 2 mice. *P < 0.05 vs. WT SFO vehicle; **P < 0.01 vs. WT SFO vehicle.
Fig. 3.
Fig. 3.
A: representative dihydroethidium (DHE) images of the dissociated WT SFO cells are shown in the presence of vehicle and 100 nmol/l ANG II. B and C: dose-response curves show effects by ANG II (N of cells = 8–24/each dose; and N of experiments = 5) and PGE2 (N of cells = 6–18/each dose; and N of experiments = 4) on the relative intensity of DHE in the presence of Veh and the AT1R antagonist Los (3 μmol/l) in WT SFO cells. *P < 0.05 vs. Veh; **P < 0.01 vs. Veh.
Fig. 4.
Fig. 4.
A: histogram shows the relative intensity of DHE in the presence of 100 nmol/l ANG II (N = 9) and coapplied ACA (1 μmol/l, N = 17), SC560 (10 μmol/l, N = 26), gp91-ds-tat (1 μmol/l, gp91, N = 8), and scrambled gp91-ds (1 μmol/l, s-gp91, N = 22) in WT SFO cells and in Nox2−/− SFO cells (N = 18) in the presence of ANG II (100 nmol/l). B: histogram summarizes the relative intensity of DHE in the presence of 100 nmol/l PGE2 (N = 7) and coapplied ACA (1 μmol/l, N = 17), SC560 (10 μmol/l, N = 7), gp91-ds-tat (1 μmol/l, gp91, N = 9), and scrambled gp91-ds-tat (1 μmol/l, s-gp91, N = 20) in WT SFO cells and in Nox2−/− SFO cells in the presence of PGE2 (100 nmol/l) (N = 18). **P < 0.01 vs. Veh.
Fig. 5.
Fig. 5.
A: representative traces shows L-type voltage-gated Ca2+ current (ICa; L-VDCC) recorded from a WT SFO neuron following applications of Veh, the Na+ channel blocker tetrodotoxin (TTX; 1 μmol/l), and N-type Ca2+ channel blocker ω-conotoxin (Ctx)-GVIA (1 μmol/l), ANG II (100 nmol/l), the AT1R antagonist Los (10 μmol/l), the selective L-VDCC activator BAY K 8644 (BayK; 2 μmol/l), and the selective L-VDCC blocker nifedipine (Nifed; 2 μmol/l). SP, stepping potential; HP, holding potential. B: current-voltage curve of L-VDCC recorded from 4 WT SFO neurons in the presence of Veh, BayK (2 μmol/l), and Nifed (2 μmol/l). C: histogram summarizes percent changes in the amplitude of L-VDCC in the presence of Veh (N = 16), ANG II (10 μmol/l, N = 9), coapplied Los (3 μmol/l, N = 9), BayK (2 μmol/l, N = 16), Nifed (2 μmol/l, N = 6), and Cd2+ (100 μmol/l, N = 6). ##P < 0.01 vs. Veh, ANG II, Los, and BayK; *P < 0.05 vs. Veh; **P < 0.01 vs. Veh.
Fig. 6.
Fig. 6.
A, top: representative traces show L-VDCC recorded from an isolated WT SFO neuron following applications of Veh, ANG II (100 nmol/l), coapplied COX-2 inhibitor NS398 (10 μmol/l), and the PLA2 inhibitor ACA (1 μmol/l). A, bottom: representative traces show L-VDCC recorded from another isolated WT SFO neuron following applications of Veh, ANG II (100 nmol/l), coapplied PGE2 type 1 receptor (EP1R) antagonist SC51089 (10 μmol/l), and L-VDCC blocker Cd2+ (100 μmol/l). B: histogram summarizes percent changes in the amplitude of L-VDCC in the presence of Veh, ANG II (100 nmol/l, N = 11), coapplied NS398 (10 μmol/l, N = 5), ACA (1 μmol/l, N = 5), SC560 (10 μmol/l, N = 6), SC51089 (10 μmol/l, N = 11) in WT SFO neurons, or L-VDCC in EP1R−/− (N = 7) SFO neurons in presence of ANG II (100 nmol/l). **P < 0.01 vs. Veh. C: time course of the amplitude of L-VDCC recorded from 1 single isolated SFO neuron before and after application of ANG II and coapplied EP1R antagonist SC51089.
Fig. 7.
Fig. 7.
A: histogram summarizes percent changes in the amplitude of L-VDCC in the presence of Veh (N = 6), ANG II (100 nmol/l, N = 6), coapplied reactive oxygen species scavenger Mn(III)tetrakis(4-benzoic acid)porphyrin chloride (MnTBAP, TBAP; 100 μmol/l, N = 6) in WT SFO neurons, or L-VDCC in Nox2−/− neurons (N = 4). **P < 0.01 vs. Veh. B: histogram shows percent changes in the amplitude of L-VDCC in the presence of vehicle (Veh, N = 16), PGE2 (100 nmol/l, N = 16), coapplied AT1R antagonist Los (10 μmol/l, N = 4), PLA2 inhibitor ACA (1 μmol/l, N = 5), SC51089 (10 μmol/l, SC, N = 7) and MnTBAP (100 μmol/l, N = 5), or in EP1R−/− neurons (N = 5), and in Nox2−/− SFO neurons (N = 5) in the presence of PGE2 (100 nmol/l). **P < 0.01 vs. Veh.
Fig. 8.
Fig. 8.
A: schematic illustration of injection of the COX-1 inhibitor SC560 (200 nmol/l) into the patched SFO neuron via the patch electrode. B: histogram summarizes percent changes in the amplitude of L-VDCC in SFO neurons intracellularly loaded with SC560 plus extracellularly perfused Veh (N = 9), ANG II (100 nmol/l, N = 9), coapplied SC51089 (10 μmol/l, N = 6), BayK (2 μmol/l, N = 4), and Cd2+ (100 μmol/l, N = 4). **P < 0.01 vs. intracellular SC560 plus extracellular Veh; ##P < 0.01 vs. all other groups.
Fig. 9.
Fig. 9.
A summary schematic overview highlights the signaling pathway proposed in the present study. Note: Nox2-containing NADPH oxidase is composed of 5 subunits, the membrane anchored catalytic subunits gp91phox (Nox2) and p22phox and the cytosolic subunits p47phox, p40phox, and p67phox. It is speculated that the intracellular increase in superoxide (O2) leads to an increase in extracellular H2O2 (53, 66). P, phosphorylated; AA, arachidonic acid; PKC, protein kinase C; [Ca2+]i, intracellular Ca2+ concentration.

Similar articles

Cited by

References

    1. Ahmad AS, Yun YT, Ahmad M, Maruyama T, Dore S. Selective blockade of PGE2 EP1 receptor protects brain against experimental ischemia and excitotoxicity, and hippocampal slice cultures against oxygen-glucose deprivation. Neurotox Res 14: 343–351, 2008 - PMC - PubMed
    1. Amberg GC, Earley S, Glapa SA. Local regulation of arterial L-type calcium channels by reactive oxygen species. Circ Res 107: 1002–1010, 2010 - PMC - PubMed
    1. Anderson JW, Smith PM, Ferguson AV. Subfornical organ neurons projecting to paraventricular nucleus: whole-cell properties. Brain Res 921: 78–85, 2001 - PubMed
    1. Bezzi P, Carmignoto G, Pasti L, Vesce S, Rossi D, Rizzini BL, Pozzan T, Volterra A. Prostaglandins stimulate calcium-dependent glutamate release in astrocytes. Nature 391: 281–285, 1998 - PubMed
    1. Borgland SL, Connor M, Ryan RM, Ball HJ, Christie MJ. Prostaglandin E(2) inhibits calcium current in two sub-populations of acutely isolated mouse trigeminal sensory neurons. J Physiol 539: 433–444, 2002 - PMC - PubMed

Publication types

MeSH terms

Substances

LinkOut - more resources