Comparative Study
. 2013 Aug 28;8(8):e72161.
doi: 10.1371/journal.pone.0072161. eCollection 2013.

Comparative analysis of induced vs. spontaneous models of autoimmune uveitis targeting the interphotoreceptor retinoid binding protein

Affiliations
Comparative Study

Comparative analysis of induced vs. spontaneous models of autoimmune uveitis targeting the interphotoreceptor retinoid binding protein

Jun Chen et al. PLoS One. .

Abstract

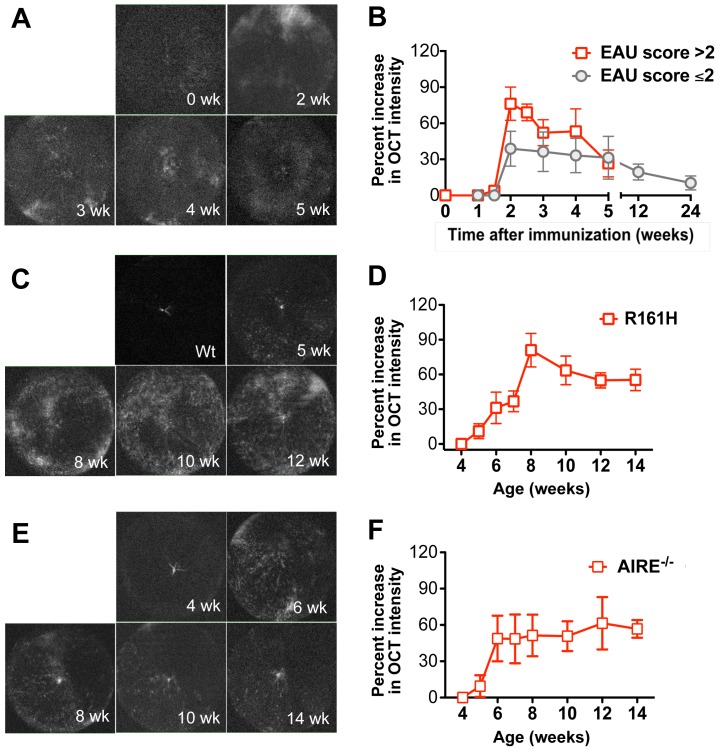
Animal models of autoimmunity to the retina mimic specific features of human uveitis, but no model by itself reproduces the full spectrum of human disease. We compared three mouse models of uveitis that target the interphotoreceptor retinoid binding protein (IRBP): (i) the "classical" model of experimental autoimmune uveitis (EAU) induced by immunization with IRBP; (ii) spontaneous uveitis in IRBP T cell receptor transgenic mice (R161H) and (iii) spontaneous uveitis in Autoimmune Regulator (AIRE)(-/-) mice. Disease course and severity, pathology and changes in visual function were studied using fundus imaging and histological examinations, optical coherence tomography and electroretinography. All models were on the B10.RIII background. Unlike previously reported, IRBP-induced EAU in B10.RIII mice exhibited two distinct patterns of disease depending on clinical scores developed after onset: severe monophasic with extensive destruction of the retina and rapid loss of visual signal, or lower grade with a prolonged chronic phase culminating after several months in retinal degeneration and loss of vision. R161H and AIRE(-/-) mice spontaneously developed chronic progressive inflammation; visual function declined gradually as retinal degeneration developed. Spontaneous uveitis in R161H mice was characterized by persistent cellular infiltrates and lymphoid aggregation, whereas AIRE(-/-) mice characteristically developed multi-focal infiltrates and severe choroidal inflammation. These data demonstrate variability and unique distinguishing features in the different models of uveitis, suggesting that each one can represent distinct aspects of uveitis in humans.


Conflict of interest statement

Competing Interests: The authors have declared that no competing interests exist.

Figures

Figure 1
Figure 1. Comparison of retinal images obtained by fundus photography, OCT, and histology in B10.RIII mouse.
A, Normal retinal layers in a healthy eye assessed by cross-sectional OCT in comparison with histology. Note the appearance of the ganglion cell layer (GCL), inner plexiform layer (IPL), inner nuclear layer (INL), outer nuclear layer (ONL), IS/OS of photoreceptor layer (PRL), retinal pigment epithelium (RPE) and choroid (CH) in the respective images. Blood vessels are indicated by arrows. B, Comparison of fundus appearance by Micron II imaging with OCT volume scan images in multiple retinal layers of normal eye.
Figure 2
Figure 2. Comparison of disease severity and course in the induced and spontaneous uveitis models.
EAU was induced in B10R.III mice by immunization with IRBP161-180 in adjuvant. Clinical scores at different stage of disease were evaluated using an adapted fundus microscope. A, EAU induced by immunization with IRBP in adjuvant; Fundus photographs shown is the chronic form of disease seen in 4/17 B10RIII mice. B, R161H uveitis (n = 16); C, AIRE−/− uveitis (n = 21). Fundus photographs in the same eye were taken using a Micro-II fundus imaging camera. Representative fundus images are shown. Data are presented as mean ± SEM of 17 mice from two individual experiments (A) and 16–21 mice from two to three individual experiments (B, C).
Figure 3
Figure 3. Changes in retinal thickness by OCT imaging in induced and spontaneous uveitis models.
A–B, EAU was induced in B10.RIII mice by active immunization with IRBP161-180 in adjuvant. B-scan OCT of the retina was evaluated at the indicated time points using a Bioptigen SD-OCT imaging system. Shown are representative examples of retinal thickness at different stages of monophasic and chronic forms of disease (A). Retinal thickness was measured and averaged from OCT images of the retina (B). C–D, Retinal thickness of R161H mice and AIRE−/− mice was evaluated at different ages using a Bioptigen SD-OCT imaging system. Data are presented as mean ± SEM of 17 mice from two individual experiments (A–B) and 16–21 mice from two to three individual experiments (C–D).
Figure 4
Figure 4. Semi-quantitative evaluation of cellular infiltrates in the vitreous of mice with induced and spontaneous uveitis.
A, Longitudinal imaging of volume scan OCT was performed during the course of EAU in the vitreous of the same eyes as in Figure 2. (A,B) IRBP induced EAU (n = 8); (C,D) R161H (n = 8); (E,F) AIRE−/− (n = 6). B, Semi-quantitative evaluation of cellular infiltrates over time. Volume-scan of OCT images was captured in the vitreous (Materials and Methods). All images were digitally processed in the same way using Photoshop to equalize background contrast levels. Signal intensity of OCT volume scan was then measured and analyzed using ImageJ analysis. Data are presented as mean ± SEM of percent increase of OCT intensity to normal or WT mice.
Figure 5
Figure 5. Histopathology of induced and spontaneous uveitis models.
A–D, Mice were immunized with IRBP in adjuvant and eyes were collected at the indicated days after immunization. Note severe ocular inflammation including vitritis, retinal swelling and destruction, retinal folds and infiltrates, subretinal hemorrhage, and choroidal inflammation at the peak of inflammation on day 14 p.i. (A–B, low and high magnification). During the acute phase of EAU, 18–21 days after immunization, eye histology showed well developed retinal lesions and infiltrating cells in the choroid, vitreous, as well as subretinal hemorrhage (arrow) (B and C). Retinal folds were seen in mice that developed the chronic form of EAU (D). E–H, Histology of R161H mice at different ages. Note cellular infiltrates and exudates in the vitreous and in the retina (E–F, low and high magnification), lymphoid aggregation in the retina (G, asterisk), photoreceptor layer destruction (H) and choroidal inflammation (G–H). I–P, Histology of AIRE−/− mice at different ages. Note severe choroiditis (I–J, low magnification; N, high magnification), granuloma-like lesions in the retina (K, low magnification; M–N, high magnification), photoreceptor layer destruction and retinal degeneration (O–P, high magnification). Fourteen B10RIII mice with EAU (10 for monophasic form, 4 for chronic form), 12 R161H and 13 AIRE−/− mice were included in the histological examination. Eyes of 2–3 mice were harvested at each time point.
Figure 6
Figure 6. Distinguishing features of retinal inflammation in induced and spontaneous uveitis models.
Retinal lesions were visualized using Micron-II fundus imaging and Bioptigen SD-OCT imaging systems in mice with induced EAU (A), R161H (B) and AIRE−/− (C) mice. Shown are: (a) fundus images; (b) three volume-scan OCT images representing the ganglion cell and inner plexiform layer (GCL/IPL), the inner/outer nuclear and inner/outer segments of the photoreceptors layer (INL/ONL/PRL), and the retinal pigment epithelium/choroid layer (RPE/CH); (c) B-scan OCT. All images are of the same eye. Note engorged blood vessels and peri-vascular exudates (green arrow) in GCL/IPL, vitreal and subretinal hemorrhages (red arrow, dark area) visible in all retinal layers (and corresponding to the same lesions in the fundus image and in OCT B-scan) and inflammation (yellow arrow) in RPE/CH.
Figure 7
Figure 7. Kinetics of dark- and light-adapted ERG response in induced and spontaneous uveitis models.
Mice that developed induced and spontaneous EAU were monitored and followed up at the indicative time points by ERG. Amplitude of dark- and light-adapted ERGs was recorded and analyzed in mice developed IRBP-induced EAU (A) and in R161H (B) and AIRE−/− (C) mice that developed spontaneous uveitis. Data represent the mean ± SEM of 17 mice from two individual experiments (A) and 16–21 mice from two to three individual experiments (B, C).

Similar articles

Cited by

References

    1. Durrani OM, Meads CA, Murray PI (2004) Uveitis: a potentially blinding disease. Ophthalmologica 218: 223–236. - PubMed
    1. Gritz DC, Wong IG (2004) Incidence and prevalence of uveitis in Northern California; the Northern California Epidemiology of Uveitis Study. Ophthalmology 111: 491–500 discussion 500. - PubMed
    1. Nussenblatt RB WS (2004) Uveitis: fundamentals and clinical practice; edition r, editor. Philadelphia: Mosby (Elsevier).
    1. Caspi RR, Chan CC, Wiggert B, Chader GJ (1990) The mouse as a model of experimental autoimmune uveoretinitis (EAU). Curr Eye Res 9 Suppl: 169–174. - PubMed
    1. Forrester JV, Liversidge J, Dua HS, Dick A, Harper F, et al. (1992) Experimental autoimmune uveoretinitis: a model system for immunointervention: a review. Curr Eye Res 11 Suppl: 33–40. - PubMed

Publication types

MeSH terms

Substances