

Quantitative reconstruction of weaning ages in archaeological human populations using bone collagen nitrogen isotope ratios and approximate Bayesian computation
- PMID: 24015234
- PMCID: PMC3754991
- DOI: 10.1371/journal.pone.0072327
Quantitative reconstruction of weaning ages in archaeological human populations using bone collagen nitrogen isotope ratios and approximate Bayesian computation
Erratum in
-
Correction: Quantitative reconstruction of weaning ages in archaeological human populations using bone collagen nitrogen isotope ratios and approximate bayesian computation.PLoS One. 2015 Mar 16;10(3):e0119778. doi: 10.1371/journal.pone.0119778. eCollection 2015. PLoS One. 2015. PMID: 25774692 Free PMC article. No abstract available.
Abstract
Background: Nitrogen isotope analysis of bone collagen has been used to reconstruct the breastfeeding practices of archaeological human populations. However, weaning ages have been estimated subjectively because of a lack of both information on subadult bone collagen turnover rates and appropriate analytical models.
Methodology: Temporal changes in human subadult bone collagen turnover rates were estimated from data on tissue-level bone metabolism reported in previous studies. A model for reconstructing precise weaning ages was then developed using a framework of approximate Bayesian computation and incorporating the estimated turnover rates. The model is presented as a new open source R package, WARN (Weaning Age Reconstruction with Nitrogen isotope analysis), which computes the age at the start and end of weaning, (15)N-enrichment through maternal to infant tissue, and [Formula: see text] value of collagen synthesized entirely from weaning foods with their posterior probabilities. The model was applied to 39 previously reported Holocene skeletal populations from around the world, and the results were compared with weaning ages observed in ethnographic studies.
Conclusions: There were no significant differences in the age at the end of weaning between the archaeological (2.80±1.32 years) and ethnographic populations. By comparing archaeological populations, it appears that weaning ages did not differ with the type of subsistence practiced (i.e., hunting-gathering or not). Most of [Formula: see text]-enrichment (2.44±0.90‰) was consistent with biologically valid values. The nitrogen isotope ratios of subadults after the weaning process were lower than those of adults in most of the archaeological populations (-0.48±0.61‰), and this depletion was greater in non-hunter-gatherer populations. Our results suggest that the breastfeeding period in humans had already been shortened by the early Holocene compared with those in extant great apes.
Conflict of interest statement
Figures

 value for bone collagen at the unit time age of
  years is represented as
  .
.

 -enrichment from maternal to infant tissue. (D) The difference between the
  value of collagen synthesized entirely from weaning foods and the mean
  value for all adults. A regression line is also shown for
  (slope = −0.514, intercept = −3.403).
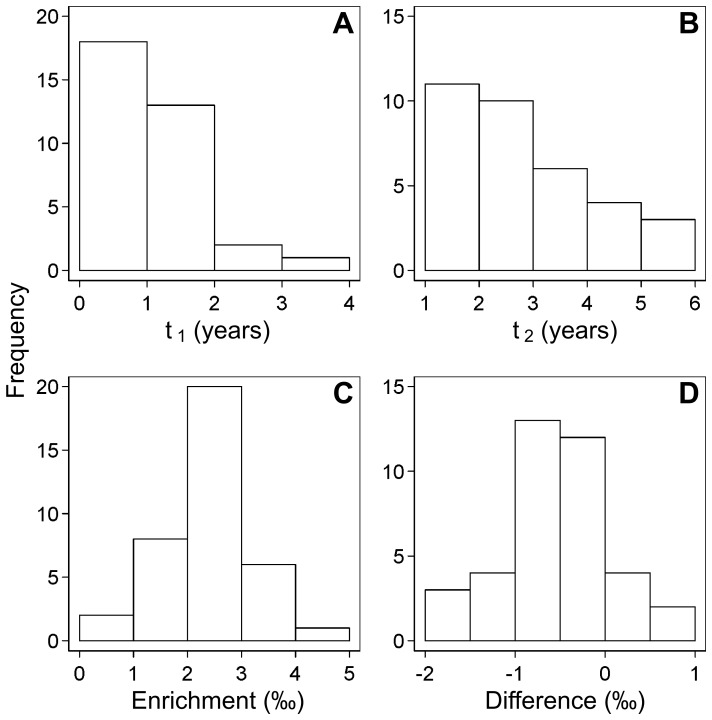


 and
and  , respectively.
References
-
- Cunningham AS (1995) Breastfeeding: adaptive behavior for child health and longevity. In: Stuart-Macadam P, Dettwyler KA, editors, Breastfeeding: biocultural perspectives, New York: Aldine de Gruyter. 243–264.
-
- Kramer MS, Kakuma R (2004) The optimal duration of exclusive breastfeeding: a systematic review. Ad Exp Med Biol 554: 63–77. - PubMed
-
- Dettwyler KA, Fishman C (1992) Infant feeding practices and growth. Annu Rev Anthropol 21: 171–204.
-
- Katzenberg MA, Herring D, Saunders SR (1996) Weaning and infant mortality: evaluating the skeletal evidence. Yearb Phys Anthropol 39: 177–199.
-
- Lewis M (2007) The bioarchaeology of children: perspectives from biological and forensic anthropology. Cambridge: Cambridge University Press.
Publication types
MeSH terms
Substances
LinkOut - more resources
Full Text Sources
Other Literature Sources
