Clinical Trial
. 2013 Aug 28;8(8):e73597.
doi: 10.1371/journal.pone.0073597. eCollection 2013.

Two independent contributions to step variability during over-ground human walking

Affiliations
Clinical Trial

Two independent contributions to step variability during over-ground human walking

Steven H Collins et al. PLoS One. .

Abstract

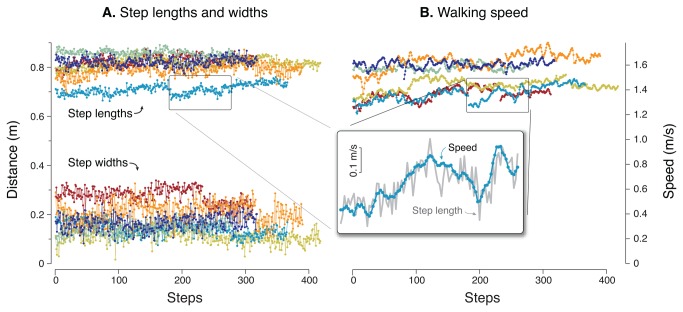
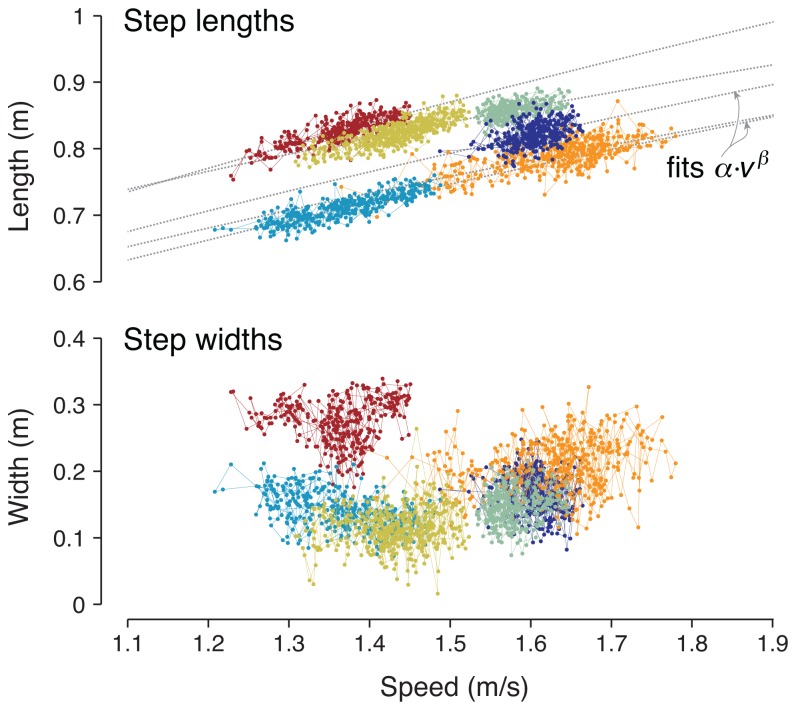
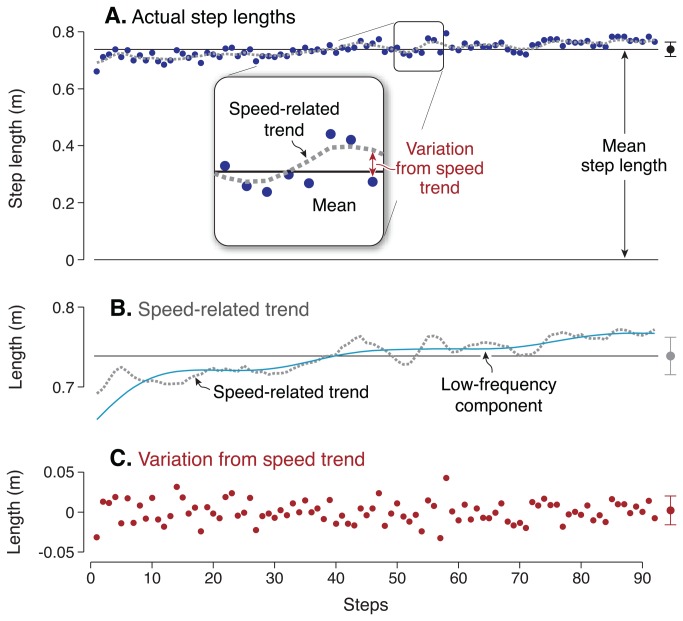
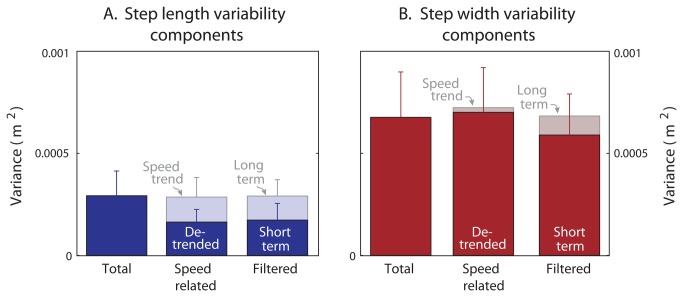
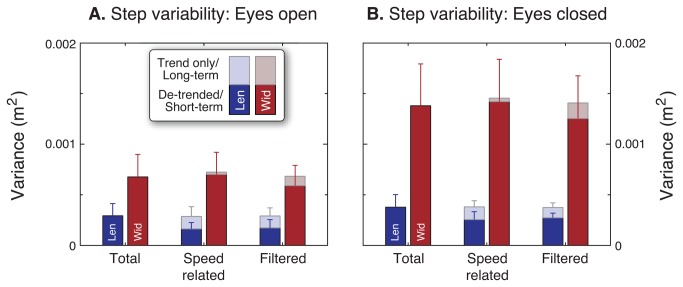
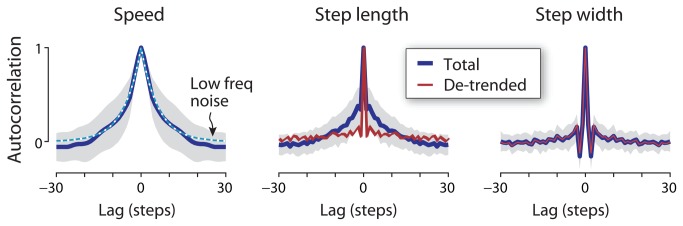
Human walking exhibits small variations in both step length and step width, some of which may be related to active balance control. Lateral balance is thought to require integrative sensorimotor control through adjustment of step width rather than length, contributing to greater variability in step width. Here we propose that step length variations are largely explained by the typical human preference for step length to increase with walking speed, which itself normally exhibits some slow and spontaneous fluctuation. In contrast, step width variations should have little relation to speed if they are produced more for lateral balance. As a test, we examined hundreds of overground walking steps by healthy young adults (N = 14, age < 40 yrs.). We found that slow fluctuations in self-selected walking speed (2.3% coefficient of variation) could explain most of the variance in step length (59%, P < 0.01). The residual variability not explained by speed was small (1.5% coefficient of variation), suggesting that step length is actually quite precise if not for the slow speed fluctuations. Step width varied over faster time scales and was independent of speed fluctuations, with variance 4.3 times greater than that for step length (P < 0.01) after accounting for the speed effect. That difference was further magnified by walking with eyes closed, which appears detrimental to control of lateral balance. Humans appear to modulate fore-aft foot placement in precise accordance with slow fluctuations in walking speed, whereas the variability of lateral foot placement appears more closely related to balance. Step variability is separable in both direction and time scale into balance- and speed-related components. The separation of factors not related to balance may reveal which aspects of walking are most critical for the nervous system to control.


Conflict of interest statement

Competing Interests: The authors have declared that no competing interests exist.

Figures

Figure 1
Figure 1. Step-by-step variability of overground walking.
(A) Step length and width are observed to vary, apparently randomly, over many overground steps (different color for each subject). (B) Walking speed also fluctuates, albeit more slowly. Examination of speed and step length together (scaled and overlaid in inset diagram) reveals that the two may in fact co-vary. Data shown are all trials performed by six representative subjects.
Figure 2
Figure 2. Representative step lengths and step widths as a function of walking speed.
Step lengths are shown along with subject-specific curve fits (Eqn. 1) for the preferred step length vs. speed (s vs. v) relationship, s = α · v β [19], with typical values of β ranging 0.27–0.55. Step width exhibits little dependence on walking speed, and appears to have greater variability than step length. Data shown are trials from six subjects, with a different color for each subject.
Figure 3
Figure 3. Decomposition of step lengths into a speed-related trend and variations from that trend.
(A) Actual step lengths are hypothesized to vary according to the preferred step length vs. speed relationship, as walking speed fluctuates slowly during over-ground walking (see Eqn. 1). (B) The speed-related trend fluctuates in close correspondence to the low-frequency, long-term components of step length (solid line), found by low-pass filtering. (C) Variations from the speed trend, or de-trended step length, appear similar to random noise. This example shows one trial from a representative subject over about 90 steps. Variability of both the speed-related trend and de-trended step length are comparable in magnitude (mean and s.d. shown as error bars at right).
Figure 4
Figure 4. Overall variance of step length and step width.
(A) Step length and (B) step width are each decomposed by de-trending and by filtering (N = 14). In each panel, the average total variability (labeled “Total” at left, with error bars for standard deviation across subjects) is contrasted with the variability of the components determined by the “Speed-related” trend and the “Filtered” components (middle and right of each panel). The speed-related trend and the de-trended step lengths (lighter and darker bars respectively) have similar variances whose sum is nearly equal to total variance. The long- and short-term components (lighter and darker bars respectively) of step length, separated by filtering, yield variances comparable to the speed-related components. In contrast, step width exhibits little speed-related trend, and little low-frequency content. The speed-related trend accounted for about half of the total variance in step length, but a negligible amount of width. De-trended step width variability was over 4 times the de-trended step length variability (P = 4.2 · 10−8).
Figure 5
Figure 5. Difference in step length and width variability between walking with eyes open and eyes closed.
(A) Eyes open. (B) Eyes closed. Each panel shows total variance of step length and width (left and right bars of each pair), speed-related length and width components, and filtered length and width components. When walking with eyes closed, subjects walked with 56% greater step length variance, and 103% greater step width variance (P < 0.05). Speed-related trends do not account for the increased gait variability with eyes closed.
Figure 6
Figure 6. Autocorrelation of walking speed, step length and step width as a function of lag in steps.
Autocorrelation of speed decreases gradually with lag (solid line denotes mean, shaded region denotes ± 1 s.d.), comparable to the long-term correlations of low-frequency noise (dashed line; 6 step correlation time constant). Total step length autocorrelation also exhibits a long-term trend, whereas de-trended step length has an autocorrelation resembling white noise. Step width autocorrelation exhibits very little long-term correlation, and de-trending has little effect on the autocorrelation. (White noise has an autocorrelation of 1 at zero lag, and 0 at all other lags.).

References

    1. Maki BE (1997) Gait changes in older adults: predictors of falls or indicators of fear. J Am Geriatr Soc 45: 313–320. PubMed: 9063277. - PubMed
    1. Hausdorff JM, Rios DA, Edelberg HK (2001) Gait variability and fall risk in community-living older adults: a 1-year prospective study. Arch Phys Med Rehabil 82: 1050–1056. doi:10.1053/apmr.2001.24893. PubMed: 11494184apmr.2001.24893 - DOI - PubMed
    1. Bauby CE, Kuo AD (2000) Active control of lateral balance in human walking. J Biomech 33: 1433–1440. doi:10.1016/S0021-9290(00)00101-9. PubMed: 10940402. - DOI - PubMed
    1. Frenkel-Toledo S, Giladi N, Peretz C, Herman T, Gruendlinger L et al. (2005) Effect of gait speed on gait rhythmicity in Parkinson’s disease: variability of stride time and swing time respond differently. J Neuroengineering Rehabil 2: 23. doi:10.1186/1743-0003-2-23. - DOI - PMC - PubMed
    1. Herman T, Giladi N, Gurevich T, Hausdorff JM (2005) Gait instability and fractal dynamics of older adults with a “cautious” gait: why do certain older adults walk fearfully? Gait Posture 21: 178–185. doi:10.1016/j.gaitpost.2004.01.014. PubMed: 15639397. - DOI - PubMed

Publication types

LinkOut - more resources