Review
. 2013 Nov:37:141-62.
doi: 10.1016/j.preteyeres.2013.08.002. Epub 2013 Sep 7.

Retinal connectomics: towards complete, accurate networks

Affiliations
Review

Retinal connectomics: towards complete, accurate networks

Robert E Marc et al. Prog Retin Eye Res. 2013 Nov.

Abstract

Connectomics is a strategy for mapping complex neural networks based on high-speed automated electron optical imaging, computational assembly of neural data volumes, web-based navigational tools to explore 10(12)-10(15) byte (terabyte to petabyte) image volumes, and annotation and markup tools to convert images into rich networks with cellular metadata. These collections of network data and associated metadata, analyzed using tools from graph theory and classification theory, can be merged with classical systems theory, giving a more completely parameterized view of how biologic information processing systems are implemented in retina and brain. Networks have two separable features: topology and connection attributes. The first findings from connectomics strongly validate the idea that the topologies of complete retinal networks are far more complex than the simple schematics that emerged from classical anatomy. In particular, connectomics has permitted an aggressive refactoring of the retinal inner plexiform layer, demonstrating that network function cannot be simply inferred from stratification; exposing the complex geometric rules for inserting different cells into a shared network; revealing unexpected bidirectional signaling pathways between mammalian rod and cone systems; documenting selective feedforward systems, novel candidate signaling architectures, new coupling motifs, and the highly complex architecture of the mammalian AII amacrine cell. This is but the beginning, as the underlying principles of connectomics are readily transferrable to non-neural cell complexes and provide new contexts for assessing intercellular communication.

Keywords: Connectome; Gap junctions; Networks; Neurons; Retina; Synapses.


Figures

Figure 1
Figure 1
Key aspects of high-resolution connectomes. (A) Small sets of serial TEM sections. The gold spots (arrows) are imaged connectome volume slices. (B) Parameters of connectomes RC1 and RC2. (C) Small molecules targeted by CMP. Top to bottom: AGB, aspartate, glutamate, glycine, glutathione, glutamine, arginine, taurine, GABA. (D) CMP imaging of GABA (red), AMPA-activated AGB (green), and glutamate (blue) in an oblique section of rabbit retina.
Fig. 2
Fig. 2
Connectome RC1 slice 001. Composed of >1000 high-resolution TEM tiles, the slice is augmented with a transparency mapping simultaneously displaying GABA (red), glycine (green, glutamate (blue), and the logical AND of glutamine and taurine signals as a dark gold alpha channel. GABA+ (red) neurons are ACs, while glycine+ (green) neurons are either ACs or an ON cone BC subset. Glutamate+ (blue) neurons are largely BCs. Image width, 243 µm. From Anderson et al., 2011, Molecular Vision 17:355–379 by permission of the authors.
Figure 3
Figure 3
RC1 volume overview. (A) The RC1 volume with its top section beginning in mid-INL and ending in the GCL shown in a mirror image. RC1 is a short cylinder ≈ 250 µm in diameter and ≈ 30 µm high containing 341 TEM sections and 11 intercalated CMP sections. The cylinder is capped at top and bottom with 10-section CMP series allowing molecular segmentation. TEM section 001 is a near-horizontal plane section through the INL visualized with GABA.glycine.glutamate → red.green.blue transparency mapping and a dark gold alpha channel (ANDed taurine + glutamine channels) described in Anderson et al. 2011a. Similarly TEM section 371 is a near-horizontal plane section through the GCL visualized with GABA.AGB.glutamate → red.green.blue transparency mapping. (B) Representative cells contained in RC1 are rendered in 3D onto the volume. Many complete copies of small cells exist (tens to hundreds) such as rod BCs (cells 1,2) and AII ACs (cell 3). A few semi-complete copies (5–10) of medium-diameter cell classes have their somas and much of their arbors within RC1, but extend outside it, such as interstitial γACs (cell 4) and AI ACs (cell 5). Finally, RC1 contains many processes from partial cells: large cells such as wide-field ACs or OFF α GCs (cell 6) with somas outside the volume and often fully traversing it. From Lauritzen et al. 2012, by permission of the authors.
Figure 4
Figure 4
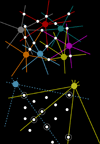
A Connectome Viz graph. The one-hop graph of interstitial AC 9769 (the inverted trapezoid at the center of the image) built automatically from annotations in rabbit retinal volume RC1. Aqua ovals are ON cone BCs (CBb) presynaptic to cell 9769. The red triangle is a γAC presynaptic to 9769, the gold ovals are beaded-process γACs both pre- and postsynaptic to 9769, while the three brown ovals are GCs postsynaptic to 9769. Grey ovals are identified but unclassified cells. Green arrows are ribbon synapses, red bars are inhibitory synapses, gold two-headed arrows are gap junctions. Black arrows are adherens junctions.
Figure 5
Figure 5
Axonal ribbons in RC1. (A) Axonal ribbons (r) at mid-axon (blue) from CBb 180 (C180) to AC targets (orange) in the OFF sublayer. CBb 180 splits high in the OFF sublayer and makes axonal ribbons immediately after the split. (B) An axonal ribbons from CBb 166 (C166) onto two different targets (orange, yellow), one of which makes a feedback synapse (arrow). Note the distinctive postsynaptic densities in the targets. Scales, 500 nm. Recomposed from Anderson et al. 2011 Molecular Vision by permission of the authors.
Figure 6
Figure 6
Axonal ribbons. The distribution of 160 axonal ribbons in 54 CBb cells and 63 ribbons in 63 of 104 rod BCs in RC1. Ribbon positions are measured relative to the sublayer a/b border, defined as the proximal face of the nearest AII AC lobule. CBb axonal ribbons are distributed throughout sublayer a. Rod BC axonal ribbons are excluded from 80% of sublayer a. Further, all rod BC ribbons exclusively target AI or AII ACs. From Lauritzen et al. 2012 J Comp Neurology, by permission of the authors.
Figure 7
Figure 7
A flow diagram for axonal ribbon motifs collapsed onto one canonical cell. Spatial distributions of axonal ribbons have been preserved to represent actual axonal ribbon locations. The axonal branch in sublamina 2 and the bifurcated descending axon are included for completeness, though both occur only in a minority of cone BC cells. In addition to abundant axonal ribbon output, CBb axons are frequently postsynaptic to ACs. S1–S6, IPL strata 1–6; red arrows, excitatory ribbon synapses; green flathead arrows, inhibitory GAC or γAC synapses; From Lauritzen et al., 2012, J Comp Neurol, by permission of the authors.
Figure 8
Figure 8
The refactored IPL. The IPL begins at the ACL (top) and at the GCL (bottom). The density of ON and OFF BC outputs are represented in orange and cyan, respectively. The classical view is that there is some border between ON and OFF layers near mid-IPL (left). The refactored view (right) addresses the mxing of ON and OFF BC outputs (right). The strength of ON drive from CBb cells is distributed in discrete bands in the OFF layer and is continuously mixed in the ON layer. This creates an ON-OFF band that spans 75% of the IPL, leaving a thin pure ON band containing CBb cells and rod BCs.
Figure 9
Figure 9
Rod-cone crossover. Eight crossover motifs between rod BCs (white circles) and patches of cone BCs (honeycomb) mediated by fields of crossing AC processes (large circles). (A) Motif C1. Coupled CBb cells (tan honeycomb) are presynaptic to wide-field ON γACs that target single rod BCs (RB, white circle) in a chain synapses for a gain of n2p (see text and Table S1). Each RB receives inhibition from a surrounding field of 15–30 CBb patches. Only three are diagrammed. (B) Motif C2. CBbs are presynaptic to narrow-field ON GACs that target single rod BCs. (C) Motif C3. CBa cells (gold honeycomb) are presynaptic to wf OFF γACs that target bistratified wf ON γACs in the OFF layer by somatic synapses, which in turn target rod BCs. (D) Motif C4/C4a. CBa cells are presynaptic to wf OFF γACs that target AI γACs in the OFF layer by GABAergic synapses on the proximal dendrites, which in turn target rod BCs. Some OFF γACs are also targeted by AII ACs in the chain. (E) Motif C5. CBa cells drive narrow-field GACs that synapse on the proximal dendrites of AI γACs. (F) Motif R1. Rod BCs drive AII ACs coupled to CBb cells. CBb cells are presynaptic to ON γACs that inhibit nearby and distant CBb cells. (G) Motif R2. Rod BCs drive AII ACs that are presynaptic to CBa cells, which drive OFF γACs to inhibit nearby and distant CBa cells. (H) Motif R3. Sparse rod BCs drive mixed rod-cone γACs that are presynaptic to large numbers of CBb cells. Lauritzen et al., in review.
Figure 10
Figure 10
Tip-to-tip BC coupling. A coupled tier of CBb5w ON BCs viewed in the XY plane (the retinal image plane). This is a new class of CBb cells that forms a precise stratum distal the new class of CBb6 cells and are coupled in-class via tip-to-tip junctions. Each cell ID allows tracking of all features in Viking (Lauritzen et al., 2013).
Figure 11
Figure 11
GC::AC coupling. (A) Layer 371 of the RC1 dataset shown as a fusion of the GABA signal (red), the TEM imagery (greyscale) and the annotation overlay (blue). Scale 50 nm. (B) Scaled inset from panel A indicating three annotated cells with ellipses: a γ− GC, γ+ GC 606 and a γ+ starburst AC. Scale 50 nm. (C) The GABA channel from layer 371 showing the absence of any signal in the γ − GC, a moderate coupling signal in the γ+ GC 606 and a strong endogenous signal in the γ+ starburst AC. Scale 50 nm. (D) γ+ GC 606 and γ+ IAC 9769 overlap and co-fasciculates at the ellipse. However coupling also occurs outside fasciculation sites. Panel width 243 µm. (E) Re-imaging of AC::GC coupling at 0.3 nm resolution. Gap junction between AC 45406 and γ+ GC 606 is slightly larger than 100 nm in extent (arrows). Scale, 100 nm. Sigulinsky et al., unpublished.
Figure 12
Figure 12
How joint distributions influence sampling. A set of BC axons (white) traverses the retina normal to the image plane. (A) A high coverage cells are displayed as different colors for every instance. Each BC axon is contacted several times for an average contact of 2.4. In the bottom field, a two different classes of GCs (yellow, blue) form part of their tiling by overlapping dendrites and sampling from the BC grid. Most BCs are missed, for an average outflow contact of 0.375, which is meaningless. Six circled BCs are contacted by the GCs (none twice), and the GCs are errorless in contacting a BC that is encountered. The point is that GCs have low Hausdorff dimensions (they are not space filling) and their sampling is idempotent, i.e. further inputs would be superfluous. Modified from Marc et al., 2013, The New Visual Neurosciences, in press, by permission of the authors.
Figure 13
Figure 13
Cross-channel synaptic nesting. (A) Viking annotation overlay in section 221 showing three cells, C20728 is a wide-field beaded ON γAC that receives input from CBb cells and is presynaptic to CBb cells, rod BCs (C 11401), other ON γACs (in class) and C1620, an ON-OFF γAC that receives input from both CBa and CBb cells. It is also presynaptic γAC 20728. (B) Annotations removed and an inset from section 224. Lauritzen et al., unpublished.
Figure 14
Figure 14
In-class and cross-class nested feedback. Using CBb3 and CBb4 cells as examples, γACs selective for each class γAC b3 and γAC b4 can either target other ACs of the same (in-class) or different classes (cross-class). The feedback is nested because two AC engaged in BC feedback also inhibit each other.
Figure 15
Figure 15
The connectome for AII ACs. There are four excitation paths (solid arrows), three coupling paths (lines), five modes of GABA inhibitory input (open arrows), and four inhibitory glycine outputs (double arrows). WF, wide field ON cone BCs; RB, rod BCs; TH1, class 1 dopaminergic axonal cells; α, alpha GCs; δ, delta GCs; pAC, peptidergic GABAergic AC; OFF AC1, dominant monostratified OFF cone AC population; OFF AC2, minor monostratified OFF cone AC population; ON AC, dominant monostratified ON cone AC population; ON SAC, ON starburst amacrine cell; AI-S2 subclass S2 class AI rod-dominated GABAergic AC. From Marc et al. 2012 Current Opinion in Neurobiology, by permission of the authors.
Fig. 16
Fig. 16
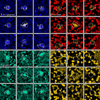
Rabbit TH+ cells have glutamatergic, not GABAergic signatures. Nine panels each showing one TH+ cell from a single rabbit retina (A–I), probed for TH, glutamate and GABA in serial 200 nm sections. Each panel shows four mappings: upper left TH (yellow) + glutamate (blue), upper right TH (yellow) + GABA (red), lower left glutamate alone (cyan), lower right GABA alone (yellow). The location of each TH+ cell is circled. Each TH+ cell has a glutamate signal higher than the surrounding amacrine cell somas and equivalent to that of a ganglion cell. TH+ cells have no measurable GABA signal. Scale, 10 µm. From Anderson et al. 2011 Molecular Vision, by permission of the authors.
Fig. 17
Fig. 17
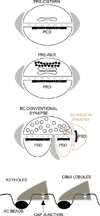
New connection architectures. (A) Cistern contacts possess a single loop of SER in the pre-cistern element, a typical synaptic cleft of ≈20 nm with periodic densities in the cleft, and a post-cistern density (PCD) similar to classical PSDs. Typically, Müller cell processes (grey profiles) sheath BC axons and de-sheath to permit cistern contacts. (B) RER contacts possess 1–2 loops of SER capped by a ribosome studded loop of RER. The post-RER density (PRD) is similar to classical PSDs. (C) Conventional BC contacts are made exclusively by cone BCs onto processes with very large PSDs (black) usually adjacent to contacts involving synaptic ribbons and smaller PSDs (gold). (D) Keyholes are arrangements where a cone BC will form a self-gap junction at the edge of a terminal lobule around the connecting neurite of a beaded AC process. These neurites are typically 30–60 nm in diameter.
Figure 18
Figure 18
ATEM imaging of new connection architectures. (A) Cistern contact between a CBb3 cone BC (blue, pre-cis) expressing a single loop of SER (arrow) and an AC (violet, post-cis) with a classic postsynaptic density (pointer). (B) RER contact between a CBb5 cone BC (blue, pre-RER) expressing a paired SER-RER apposition (arrow) apposed to a GC (violet, post-RER) with a classic postsynaptic density (pointer). (C) Conventional contacts between a CBb5w cone BC (blue, pre-BCC) with vesicles directly attached to the presynaptic membrane (white arrows) and a coated endocytotic omega figure (yellow arrow) apposed to a GC with a classic postsynaptic density and cleft (pointer). (D) A keyholes formed by a CBb4w cone BC (blue) via self-gap junctions (paired white arrows), trapping a linking process of 30 nm diameter from a beaded AC. All scale bars are 500 nm. Figure 19A is from Anderson et al., 2011, by permission of the authors.
Figure 19
Figure 19
Novel roles for non-neuronal cells. (A) A binucleate microglial cell C5016) with lateral processes contacting rod bipolar cells B519 and B5017. (B) The inset from panel D showing Insertion of a microglial process (oval) close to the synaptic ribbon (r) of rod bipolar cell B5017. (C) A section through the endfeet of two Müller cells (outlined) at the retina-vitreous border. The endfeet contain a filament-rich matrix and a large organelle of OSER. Arrow, 9 µm. (D) The inset from panel F showing the transition between the core matrix and the OSER organelle, bounded by SER stacks. D–G Scales, 1000 nm. Marc et al., unpublished.
Figure 20
Figure 20
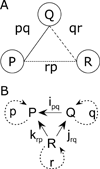
Simple network graphs. (A) An undirected graph with vertices PQR and bidirectional edges pq, qr, rp. (B) A complex direct graph with vertices PQR, directed edges i (p → q), j (r → q), k (r → p), and re-entrant edges pqr.

Similar articles

Cited by

References

    1. Amari SI, Beltrame F, Bjaalie JG, Dalkara T, Schutter ED, Egan GF, Goddard NH, Gonzalez C, Grillner S, Herz A, Hoffmann KP, Jaaskelainen I, Koslow SH, Lee SY, Matthiessen L, Miller PL, Silva FMD, Novak M, Ravindranath V, Ritz R, Ruotsalainen U, Sebestra V, Subramaniam S, Tang Y, Toga AW, Usui S, Pelt JV, Verschure P, Willshaw D, Wrobel A. Neuroinformatics: The integration of shared databases and tools towards integrative neuroscience. Journal of Integrative Neuroscience. 2002;1:117–128. - PubMed
    1. Anderson JR, Grimm B, Mohammed S, Jones BW, Spaltenstein J, Koshevoy P, Tasdizen T, Whitaker R, Marc RE. The Viking Viewer: Scalable multiuser annotation and summarization of large connectomics datasets. J Microscopy. 2011a;241:13–28. - PMC - PubMed
    1. Anderson JR, Jones BW, Watt CB, Shaw MV, Yang J-H, DeMill D, Lauritzen JS, Lin Y, Rapp KD, Mastronarde D, Koshevoy P, Grimm B, Tasdizen T, Whitaker R, Marc RE. Exploring the retinal connectome. Molecular Vision. 2011b;17:355–379. - PMC - PubMed
    1. Anderson JR, Jones BW, Yang J-H, Shaw MV, Watt CB, Koshevoy P, Spaltenstein J, Jurrus E, UV K, Whitaker R, Mastronarde D, Tasdizen T, Marc RE. A computational framework for ultrastructural mapping of neural circuitry. PLoS Biol. 2009;7(3):e1000074. - PMC - PubMed
    1. Aster R, Borchers B, Thurber C. Parameter Estimation and Inverse. Problems. NY: Academic Press; 2005.

Publication types