

Functional signature of recovering cortex: dissociation of local field potentials and spiking activity in somatosensory cortices of spinal cord injured monkeys
- PMID: 24017995
- PMCID: PMC3870899
- DOI: 10.1016/j.expneurol.2013.08.013
Functional signature of recovering cortex: dissociation of local field potentials and spiking activity in somatosensory cortices of spinal cord injured monkeys
Abstract
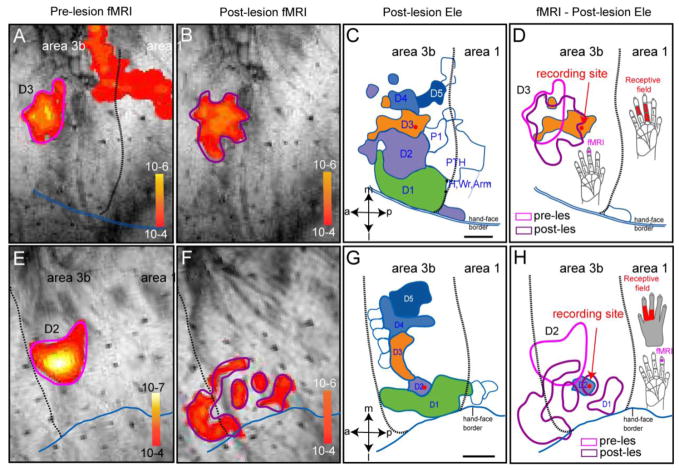
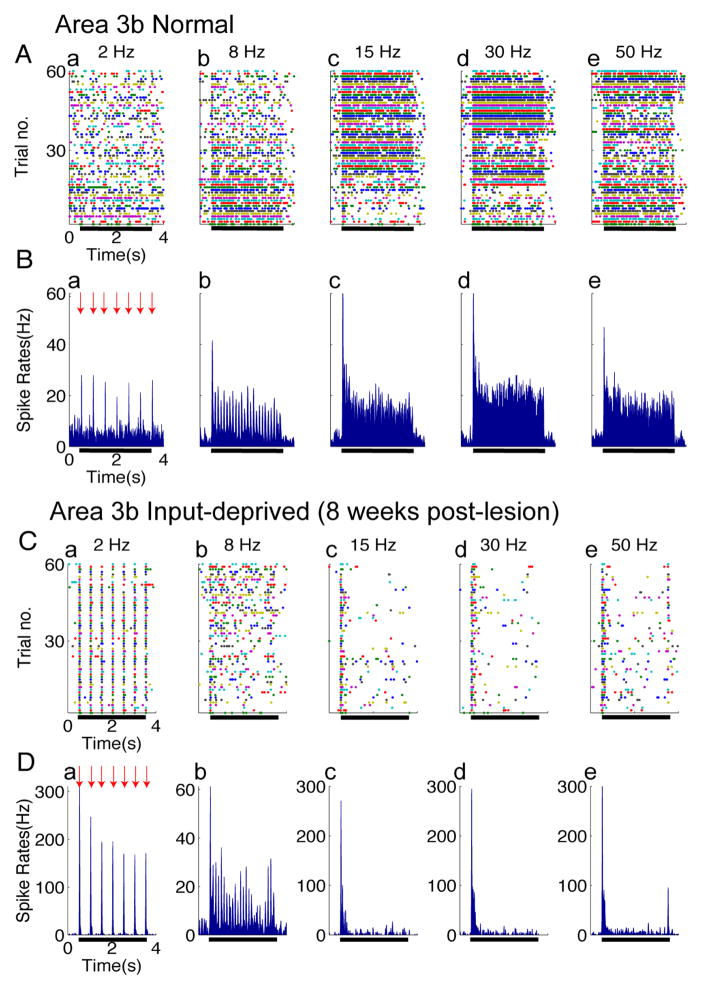
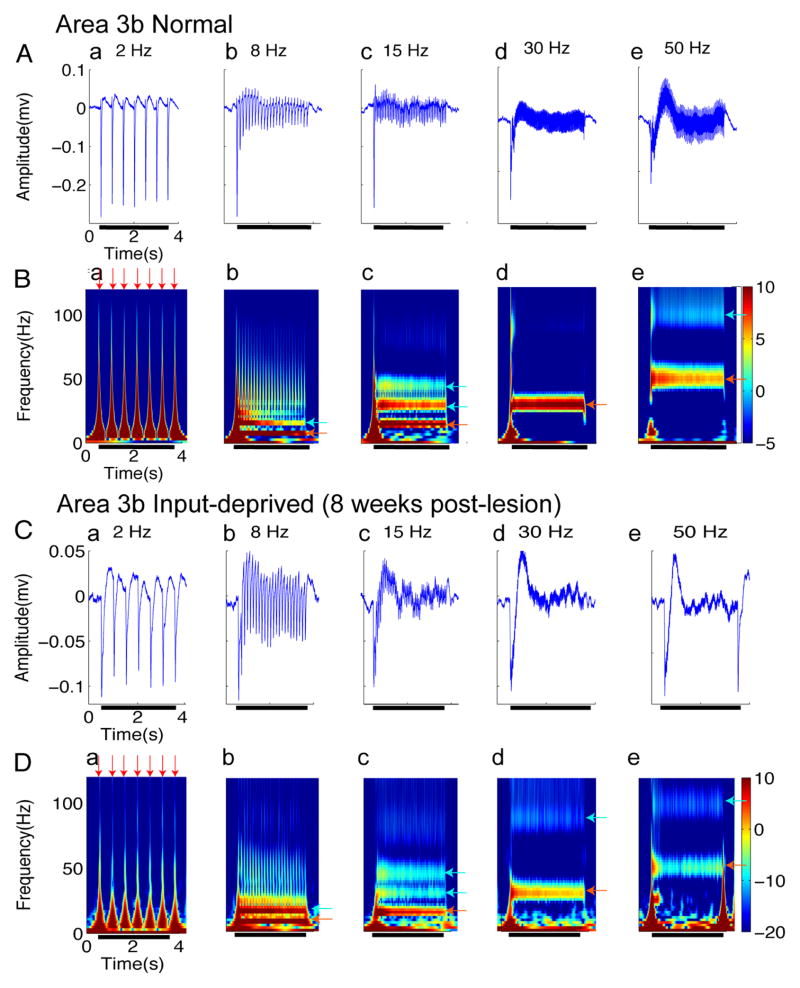
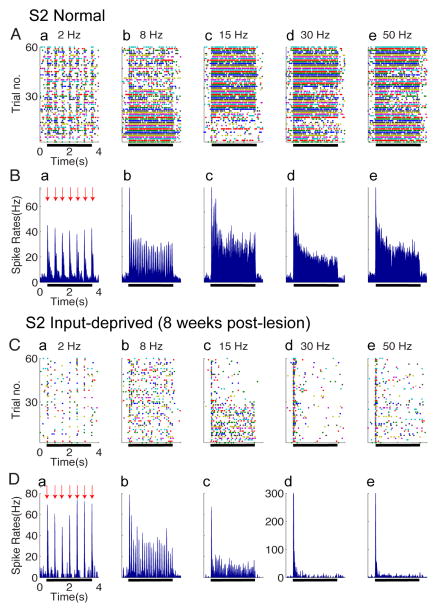
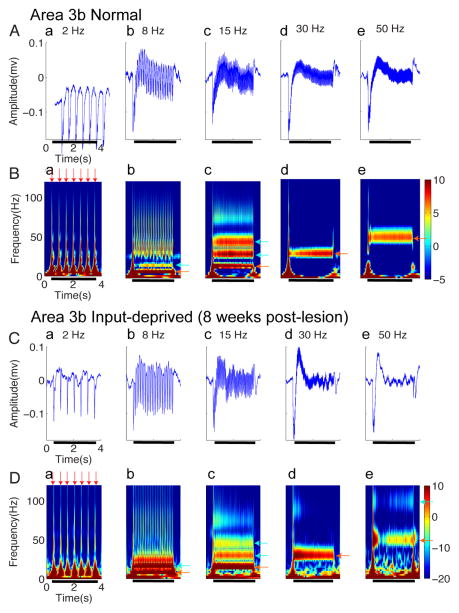
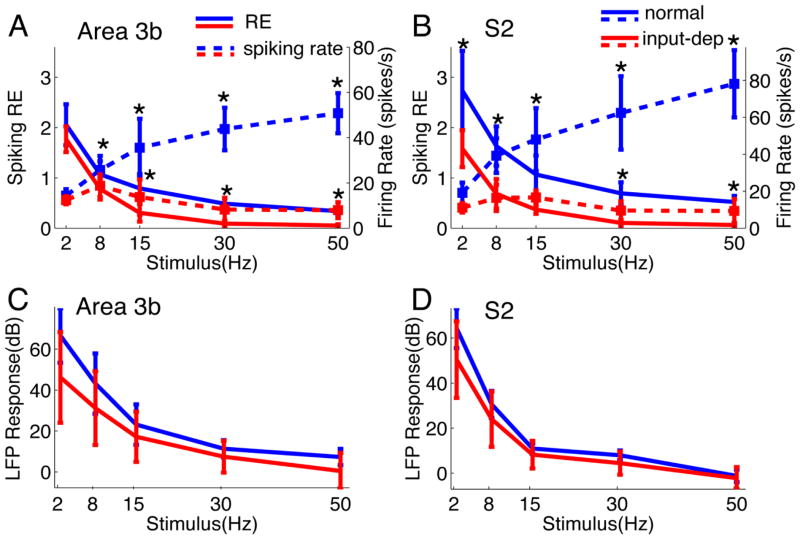
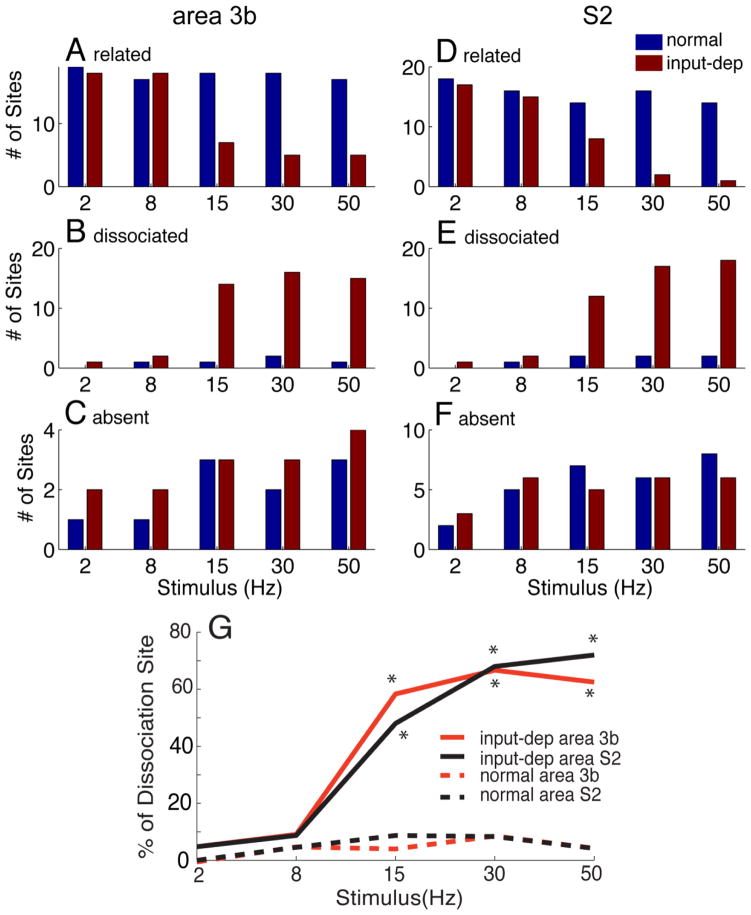
After disruption of dorsal column afferents at high cervical spinal levels in adult monkeys, somatosensory cortical neurons recover responsiveness to tactile stimulation of the hand; this reactivation correlates with a recovery of hand use. However, it is not known if all neuronal response properties recover, and whether different cortical areas recover in a similar manner. To address this, we recorded neuronal activity in cortical area 3b and S2 in adult squirrel monkeys weeks after unilateral lesion of the dorsal columns. We found that in response to vibrotactile stimulation, local field potentials remained robust at all frequency ranges. However, neuronal spiking activity failed to follow at high frequencies (≥15 Hz). We suggest that the failure to generate spiking activity at high stimulus frequency reflects a changed balance of inhibition and excitation in both area 3b and S2, and that this mismatch in spiking and local field potential is a signature of an early phase of recovering cortex (<two months).
Keywords: Local field potential; Neuron spikes; Primates; Somatosensory cortex; Spinal cord injury; Touch.
© 2013.
Figures
Similar articles
-
Reorganization of Higher-Order Somatosensory Cortex After Sensory Loss from Hand in Squirrel Monkeys.Cereb Cortex. 2019 Sep 13;29(10):4347-4365. doi: 10.1093/cercor/bhy317. Cereb Cortex. 2019. PMID: 30590401 Free PMC article.
-
Reorganization of somatosensory cortical areas 3b and 1 after unilateral section of dorsal columns of the spinal cord in squirrel monkeys.J Neurosci. 2011 Sep 21;31(38):13662-75. doi: 10.1523/JNEUROSCI.2366-11.2011. J Neurosci. 2011. PMID: 21940457 Free PMC article.
-
Differential Recovery of Submodality Touch Neurons and Interareal Communication in Sensory Input-Deprived Area 3b and S2 Cortices.J Neurosci. 2022 Dec 14;42(50):9330-9342. doi: 10.1523/JNEUROSCI.0034-22.2022. Epub 2022 Nov 15. J Neurosci. 2022. PMID: 36379707 Free PMC article.
-
Cortical and subcortical plasticity in the brains of humans, primates, and rats after damage to sensory afferents in the dorsal columns of the spinal cord.Exp Neurol. 2008 Feb;209(2):407-16. doi: 10.1016/j.expneurol.2007.06.014. Epub 2007 Jul 6. Exp Neurol. 2008. PMID: 17692844 Free PMC article. Review.
-
The reactivation of somatosensory cortex and behavioral recovery after sensory loss in mature primates.Front Syst Neurosci. 2014 May 12;8:84. doi: 10.3389/fnsys.2014.00084. eCollection 2014. Front Syst Neurosci. 2014. PMID: 24860443 Free PMC article. Review.
Cited by
-
Intrinsic functional architecture of the non-human primate spinal cord derived from fMRI and electrophysiology.Nat Commun. 2019 Mar 29;10(1):1416. doi: 10.1038/s41467-019-09485-3. Nat Commun. 2019. PMID: 30926817 Free PMC article.
-
Cortical neuron response properties are related to lesion extent and behavioral recovery after sensory loss from spinal cord injury in monkeys.J Neurosci. 2014 Mar 19;34(12):4345-63. doi: 10.1523/JNEUROSCI.4954-13.2014. J Neurosci. 2014. PMID: 24647955 Free PMC article.
-
Parallel functional reorganizations of somatosensory areas 3b and 1, and S2 following spinal cord injury in squirrel monkeys.J Neurosci. 2014 Jul 9;34(28):9351-63. doi: 10.1523/JNEUROSCI.0537-14.2014. J Neurosci. 2014. PMID: 25009268 Free PMC article.
-
Reorganization of Higher-Order Somatosensory Cortex After Sensory Loss from Hand in Squirrel Monkeys.Cereb Cortex. 2019 Sep 13;29(10):4347-4365. doi: 10.1093/cercor/bhy317. Cereb Cortex. 2019. PMID: 30590401 Free PMC article.
-
Dexmedetomidine - Commonly Used in Functional Imaging Studies - Increases Susceptibility to Seizures in Rats But Not in Wild Type Mice.Front Neurosci. 2020 Oct 29;14:832. doi: 10.3389/fnins.2020.00832. eCollection 2020. Front Neurosci. 2020. PMID: 33192234 Free PMC article.
References
-
- Arezzo J, Legatt AD, Vaughan HG., Jr Topography and intracranial sources of somatosensory evoked potentials in the monkey. I. Early components. Electroencephalogr Clin Neurophysiol. 1979;46:155–72. - PubMed
-
- Arthurs OJ, Boniface S. How well do we understand the neural origins of the fMRI BOLD signal? Trends Neurosci. 2002;25:27–31. - PubMed
-
- Attwell D, Iadecola C. The neural basis of functional brain imaging signals. Trends Neurosci. 2002;25:621–5. - PubMed
-
- Ballermann M, McKenna J, Whishaw IQ. A grasp-related deficit in tactile discrimination following dorsal column lesion in the rat. Brain Res Bull. 2001;54:237–42. - PubMed
-
- Bartolo MJ, Gieselmann MA, Vuksanovic V, Hunter D, Sun L, et al. Stimulus-induced dissociation of neuronal firing rates and local field potential gamma power and its relationship to the resonance blood oxygen level-dependent signal in macaque primary visual cortex. Eur J Neurosci. 2011;34:1857–70. - PMC - PubMed
Publication types
MeSH terms
Grants and funding
LinkOut - more resources
Full Text Sources
Other Literature Sources
Medical
